
Last updated August 2026
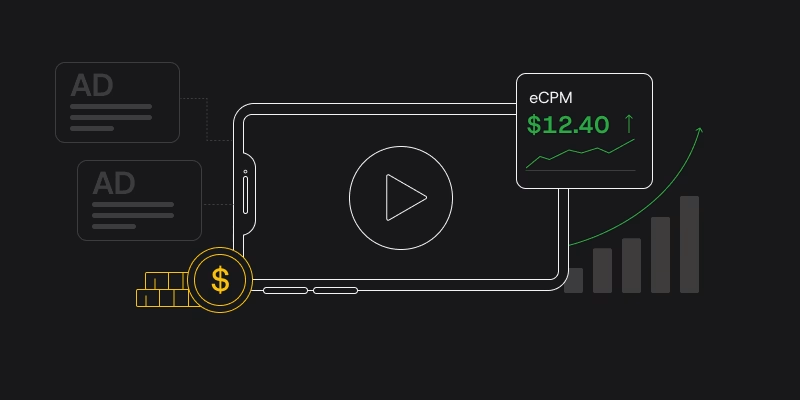
eCPM is the number that shows you what you are really earning for every thousand times an ad pops up in your app. Forget clicks or installs. This is about cold, hard impressions. If you have ads in your mobile app, eCPM is the one metric that lets you compare apples to apples, no matter the network, format, or country. In this guide, I will walk you through the eCPM formula with a real example, show you what a good eCPM looks like for different formats and regions, break down what actually moves the number, and give you some ways to push it higher.If you monetize a mobile app or digital publication through programmatic advertising, eCPM (Effective Cost Per Mille) is the single most important number in your revenue dashboard. Mille is Latin for “thousand.” Strip away the ad tech lingo, and this metric tells you how much money you earn for every 1,000 ad impressions your app displays. If you’re looking to maximize app revenue, choosing the best eCPM mobile ad network is one of the most important decisions you’ll make.
Why does one number matter so much? Because mobile monetization in 2026 is messier than it’s ever been. On any given day, your app might serve Cost Per Click (CPC) campaigns, Cost Per Action (CPA) user-acquisition ads, real-time bidding (RTB) auctions, and flat-rate Cost Per Mille (CPM) direct deals. Many developers struggle to identify the best eCPM mobile ad network because rates can vary significantly depending on region, ad format, and user engagement. These can often occur in the same waterfall, sometimes in the same session. Comparing those payout models directly is like comparing apples to oranges, and that’s exactly the problem this metric was built to solve.
That’s where the eCPM full form does the heavy lifting: effective cost per mille, what you actually earned per thousand impressions, no matter how the network chose to pay you.
This guide covers the formula with worked examples, the eight factors that push your rate up or down, and the strategies publishers actually use to raise it without wrecking fill rate or retention.
What Is eCPM?
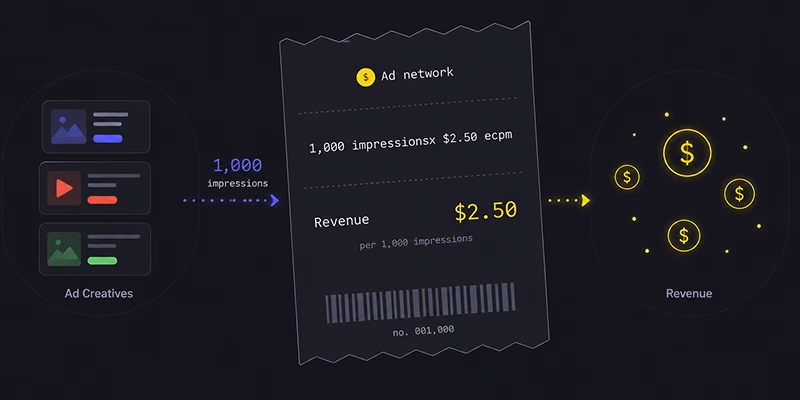
eCPM (effective cost per mille) is the ad revenue a publisher earns for every 1,000 ad impressions. The eCPM meaning is that simple: revenue per 1,000 impressions, full stop. It’s calculated by dividing total ad earnings by the number of impressions and multiplying by 1,000. eCPM lets you compare what different networks, formats, countries, and placements actually generate, regardless of whether the underlying deal is CPM, CPC, or CPA.
Raising eCPM is one lever inside a bigger revenue picture. If you’re still deciding which formats, ad-to-IAP ratio, or hybrid model fits your app, start with our app monetization guide — the tactics below assume ads are already a core part of your mix. For app developers, ad operations managers, and monetization strategists, this figure is the baseline needed to compare performance among ad networks, formats, geographies, and app versions, because raw payout models don’t compare cleanly on their own.
Picture three networks bidding for the same placement:
- Network A pays $0.15 every time a user clicks an ad (CPC).
- Network B pays $4.00 every time a user installs a competing app (CPA).
- Network C pays a flat $1.50 per 1,000 impressions (CPM).
Without a shared unit, you can’t tell which network actually earns you more per session. This is the gap eCPM closes: it converts every dollar, regardless of the payment trigger, into one standardized value per 1,000 impressions, so a click-based deal, an install-based deal, and a flat-rate deal all land on the same scale and can be ranked against each other directly.
How eCPM Works Under the Hood
To understand this figure, you have to look at what happens during a real-time programmatic auction. This is the mechanism that decides what a given impression is actually worth.
When a user opens your app or reaches an ad placement (the end of a game level, the bottom of a news article), the app fires an ad request to your mediation platform or ad server.
- Evaluation phase. Demographics, device type, location, historical behavior, and available IDFA/GAID signals are packaged into a bid request.
- Demand-side response. DSPs, ad networks, and direct advertisers evaluate that user profile. A high-LTV casino app might bid aggressively for a US-based iOS user; an e-commerce brand might bid conservatively for an Android user in an emerging market.
- Payout trigger. A CPM-based winner pays for rendering the ad. A CPC-based winner pays only if the user taps it, so if 1,000 users see it and 10 tap, your real earnings come from those 10 clicks, then get mapped back into a per-thousand rate. A CPA-based winner pays only on install or in-app registration.
Because engagement swings wildly by placement and creative quality, eCPM is your post-auction reality check. It shows what impressions actually yielded once click-through and conversion behavior are factored in, not just what was theoretically on offer.
The eCPM Formula
Understanding eCPM: The Publisher’s Metric for Monetization
Ask what is eCPM in advertising, and the short answer is a normalizer: one per-thousand-impressions rate that makes CPC, CPA, and CPM deals directly comparable.
Understanding how to calculate eCPM (effective Cost Per Mille) helps publishers and advertisers measure the revenue generated per thousand ad impressions across different channels. eCPM formula: eCPM = (Total Ad Revenue ÷ Total Impressions) × 1,000:
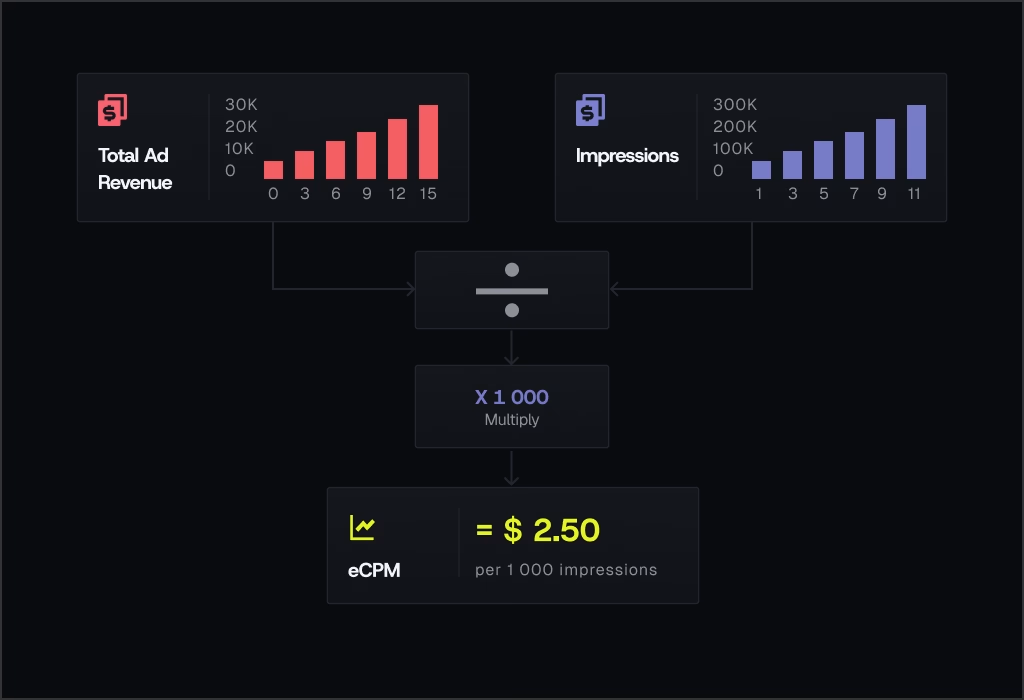
To see this in practice, imagine your mobile app pulls in $500 from ads in a single day while racking up 250,000 ad impressions, and dividing your total revenue ($500) by impressions (250,000) and multiplying by 1,000 yields an eCPM of $2.00. This means you earn exactly two dollars for every thousand ads displayed to users.
While high-level daily averages provide a basic overview, the real strategic insight comes when you segment eCPM data. By breaking down eCPM by individual ad network, geographic region, and ad format (such as rewarded video, interstitial, or banner ads), you can identify patterns and trends that may not be immediately apparent from aggregate figures. Tracking this performance metric in detail reveals what is driving revenue and where optimization is needed, empowering publishers to refine their strategies and unlock additional earning opportunities.
Combining a reliable eCPM calculator with deep insights into top-performing mobile ad network options gives you a much clearer picture of your app’s overall monetization potential, helping you maximize yield effectively. Regularly analyzing and adjusting your monetization approach based on eCPM trends ensures continued growth and long-term success in a competitive mobile advertising landscape.
eCPM vs CPM
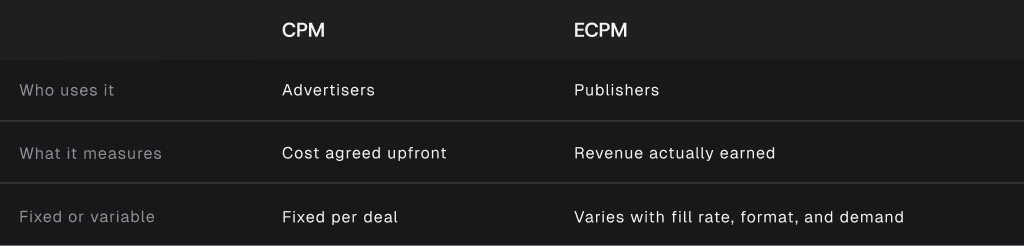
CPM (Cost Per Mille) and eCPM (effective Cost Per Mille) are two common but different terms in digital advertising, and it’s easy to confuse them. CPM refers to the amount an advertiser agrees to pay for every thousand ad impressions, and this rate is usually set in advance, before any auction or bidding process.
On the other hand, eCPM is a metric used by publishers to measure their actual earnings per thousand impressions. eCPM takes into account all the factors that affect revenue, such as fill rate, actual winning bids, and variations in demand, so it reflects the real outcome for the publisher, not just the starting price. In short, CPM represents the buyer’s cost and is fixed ahead of time, while eCPM is the seller’s result and varies based on real-world performance.
Understanding this important distinction helps both advertisers and publishers optimize their strategies for better results and maximize their revenue over time.
The Standard Formula
eCPM=(Total Ad RevenueTotal Ad Impressions)×1,000\text{eCPM} = \left( \frac{\text{Total Ad Revenue}}{\text{Total Ad Impressions}} \right) \times 1{,}000eCPM=(Total Ad ImpressionsTotal Ad Revenue)×1,000
Before you dive into optimizing your campaigns, it’s worth understanding how to calculate eCPM, since this metric forms the foundation of most ad revenue reporting.
How to Calculate eCPM: Step-by-Step
- Pull total ad revenue for the period you’re measuring (a day, a placement, a network).
- Pull total served impressions for that same period and same segment.
- Divide revenue by impressions.
- Multiply by 1,000.
Skip a step and mix a week of revenue with a single day of impressions, and you’ll end up with a wildly wrong number. The whole comparison falls apart. If you’d rather not do this by hand across dozens of segments, our free eCPM calculator. An eCPM calculator takes the guesswork out of the equation, letting you quickly estimate earnings based on impressions and total revenue.
Basic Example
Suppose your casual puzzle game generated $1,200 in ad revenue yesterday across all placements, on 600,000 served impressions.
eCPM=($1,200600,000)×1,000=$2.00\text{eCPM} = \left( \frac{$1{,}200}{600{,}000} \right) \times 1{,}000 = $2.00eCPM=(600,000$1,200)×1,000=$2.00
That’s your blended baseline for the day. It is useful as a headline number, but it hides where the money actually came from.
Advanced Multi-Format Breakdown
Lumping all revenue and impressions into one average hides actionable insight. To optimize, calculate the rate separately for each ad format, country, and network partner. Consider a mid-core mobile game over 30 days:
Ad Format Monthly Revenue Served Impressions Realized Rate
- Banner Ads $1,500 3,000,000 $0.50
- Interstitial Ads $12,000 2,000,000 $6.00
- Rewarded Video $25,000 1,000,000 $25.00
- Combined Total $38,500 6,000,000 $6.42 (blend)
Banner ads accounted for 50% of all served impressions but generated under 4% of total revenue. Rewarded video generated 65% of revenue on just 16.6% of impressions, which is a rate 50 times higher than banners. That gap is exactly what granular tracking is for: it tells you where to spend your product design effort, not just your reporting effort.
What Is a Good eCPM? (2026 Industry Benchmarks)
There’s no universal “good” number here. A $1.50 banner rate in Brazil can represent excellent optimization, while the same $1.50 on rewarded video in the US signals a broken setup. Expectations move on three axes: ad format, geographic tier, and operating system.
- By ad format: Banners sit passively on screen and pull click-through rates as low as 0.10%–0.50%, which caps what advertisers are willing to bid. Interstitials force viewability at natural pause points, so they clear moderate-to-high rates. Rewarded video, where users opt in for a reward, routinely sees 85% to 90% completion, which is why it commands top-tier pricing. Offerwalls monetize on a per-completion basis across a menu of actions, which is what pushes their effective rate the highest of all.
- By operating system: Across nearly every vertical and region, iOS inventory yields 20% to 50% more than Android. iOS users show higher average purchasing power and lifetime value, so advertisers bid more aggressively for that inventory even with App Tracking Transparency limiting some targeting signal.
- By geography: This is usually the single biggest swing factor. Tier-1 markets combine high purchasing power with dense advertiser competition and deep local ad budgets. Tier-2 and Tier-3 markets have lower purchasing power per user and thinner local ad spend, which means less auction density and lower baseline bids. This does not necessarily mean a weaker product.
Average eCPM by format and country, based on CAS.AI mediation traffic, 2026:
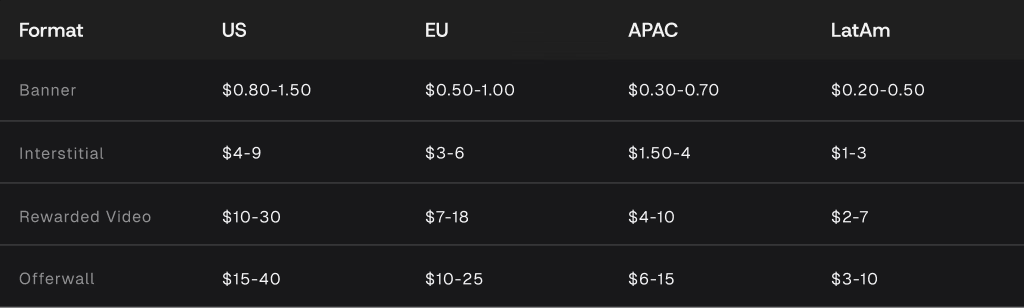
If you want to know what a good eCPM looks like for your app, you have to compare it to your own format and region, not some global average. Context is everything. Mobile ads eCPM $1.50 banner eCPM in Latin America is a whole different story from a $1.50 rewarded video eCPM in the US.
Most of what you hear about the best eCPM ad network is just noise. The top network for you depends on your audience, where your users are, and even the week. That is why mediation makes sense instead of putting all your chips on one network.
What affects eCPM? The 8 Factors That Directly Move Your eCPM
- Audience geography & purchasing power. Advertisers bid on expected ROAS. A user evaluating a fintech app in a wealthy market represents far higher potential lifetime value to a buyer than a user evaluating a hyper-casual title in a low-spend market. Higher potential value drives higher bids.
- Ad format & creative specs. Rich media, playables, and interactive video units demand more screen real estate and creative investment, and they earn correspondingly higher engagement. This shows up directly in the rate advertisers are willing to pay.
- Viewability & placement architecture. A served impression isn’t the same as a seen impression. Buyers track placement-level viewability history, and placements that get scrolled past before rendering fully see their bids erode over time.
- Seasonality & budget cycles. Q1 typically sees 15% to 30% dips as corporate budgets reset after the holidays. Q4 brings Black Friday, Cyber Monday, and Christmas, which drives the year’s highest competition among e-commerce and gaming advertisers. End-of-month and end-of-quarter often bring short-lived spikes as DSPs rush to exhaust remaining budget.
- Historical CTR & CVR. Placements that consistently drive real clicks and post-click conversions earn a higher internal quality score with ad networks, and higher quality scores translate into higher bids in performance-based auctions.
- Signal depth & user identification. In a post-ATT, post-Privacy-Sandbox ecosystem, impressions carrying rich identifiers (IDFA, GAID, verified first-party data) command higher prices than anonymous, context-only inventory.
- Mediation setup & auction competition. A single-network setup leaves you exposed to that one partner’s demand gaps. Running an open, unified mediation layer where 15+ networks and bidders compete for the same impression in real time is usually the fastest path to the best eCPM mobile ad network setup you can build. Competition, not any single partner, is what raises the price.
- Floor price strategy. A floor is a hard minimum: if no bidder clears it, the request goes unfilled. Floors protect inventory value, but if you set them too high, you trade fill rate for a headline number that never turns into real revenue.
eCPM calculation only tells you what already happened. These levers are what change what happens next.
How to Increase eCPM
- Add rewarded and interstitial ads to your mix. Running only banners is leaving money on the table.
- Run mediation so multiple networks compete for the same impression in real time.
- Set your eCPM floors on purpose, then keep testing and tweaking them. Setting and forgetting is a recipe for missed revenue.
- Treat your traffic by region, not as one big lump. Optimizing by geo can make a real difference.
- Run A/B tests on your placements and waterfalls regularly. What worked in March probably will not work the same way in December.
This brings in high-value ad formats like rewarded and interstitials, while banners barely move the needle alone. Rewarded video gives users clear value in exchange for attention, driving higher completion rates and stronger payouts. Interstitials deliver big revenue boosts when placed thoughtfully. The key is finding balance between monetization and player satisfaction.
Don’t just stack more ads and hope it works. Set frequency caps and track the player journey closely to avoid burnout. Ad metrics shift quickly; what worked last quarter can flop now. Continuously test placements and adjust fast when data tells you to.
If you want to know how to increase eCPM, competition for every single impression is non-negotiable. When 20+ networks bid in real time through one independent mediation layer, the winning price rises automatically. That is the core reason publishers who move to independent mediation typically see a 1.5x to 2x ARPU lift. Compare mediation partners, optimize aggressively, and don’t settle for mediocre fill rates or lower returns.
Set your eCPM floors with purpose and never set and forget. Dig into your data, adjust floors by region, and keep tuning as results shift. Don’t treat your traffic as a single block. Ad rates change by country, so build your strategy by geo to capture hidden value. Optimize, test, and repeat continuously.
The market moves fast, so move faster. Test your placements, waterfalls, and ad setups regularly to stay ahead of changing player behavior.
Advanced Strategies: How to Increase Your eCPM
Strategy 1: Move to in-app bidding (hybrid mediation). Traditional waterfalls call Network A, then B, then C in a fixed order based on historical averages. This process is slow, and it routinely sells inventory below its real market value. In-app bidding makes every connected demand source submit a real-time bid for the exact session available, and the mediation layer routes the impression to the highest bidder in milliseconds. An open ad mediation setup is what makes this instantaneous competition possible in the first place. The more qualified demand sources bidding simultaneously, the closer the winning bid gets to what a placement is actually worth.
Strategy 2: Set dynamic, geo-segmented floors. A single global floor is a recipe for lost revenue in both directions. For example, a $5.00 floor rejects valuable Tier-3 demand that maxes out around $2.00, while that same $5.00 floor in the US quietly accepts lowball bids from buyers who’d have paid $15.00 if forced to compete. Group traffic into geo buckets, set higher micro-floors where local demand supports it, and keep floors lower in emerging markets to protect fill rate.
Strategy 3: Optimize placement mechanics and native integration. In-feed native ads that match your app’s visual styling reduce ad fatigue and outperform static banners on CTR. Position rewarded-video entry points at genuine friction points, such as when a user is out of lives or seeking a boost. This is where motivation (and completion rates) run highest. Place interstitials at natural transitions rather than on launch or mid-action, which protects both viewability and retention.
Strategy 4: Fine-tune banner refresh rates. Refreshing a banner every 10 seconds tanks viewability and CTR, and demand partners notice and lower their real-time bids accordingly. A 30 to 60 second refresh interval, paused whenever the app is backgrounded or the banner is off-screen, is the safer default.
Strategy 5: Test continuously. Compare interstitial timing after Level 1 vs. Level 2. Compare a $12.00 floor against an $8.00 floor on US rewarded video and check the effect on total ARPU, not just the headline rate. Once you’ve made a change, re-run the formula on the revised numbers to confirm the lift is real and not just seasonal noise.
Key Takeaways
The single biggest lever for increasing eCPM is competition for each impression. When 20+ networks bid in real time through one mediation layer, the winning price rises automatically. That is the core reason publishers who move to independent mediation typically see a x1.5–2x ARPU lift.
- Definition: Effective Cost Per Mille normalizes all ad earnings into one measurement: actual revenue earned per 1,000 served impressions.
- Publisher vs. buyer: CPM is what advertisers commit to spend upfront. eCPM is what publishers actually realize after the auction plays out.
- Context is everything: There’s no single “good” number. It depends on ad format, geography, and OS, and the 2026 benchmarks above vary by 50x or more across those axes.
- Fill rate matters: A sky-high rate paired with a collapsed fill rate still means lost revenue. Track it alongside ARPDAU, not instead of it.
- Competition wins: Moving from single-network setups to unified, real-time in-app bidding is the most reliable lever for a durable increase.
Frequently Asked Questions (FAQ)
What does eCPM stand for? Effective Cost Per Mille. Mille is Latin for “thousand.” It represents effective ad earnings per 1,000 impressions served within an app or digital property.
How do you calculate eCPM?
Here is how to calculate eCPM: divide total ad revenue by total impressions, then multiply by 1,000. For example, $500 over 250,000 impressions equals a $2.00 eCPM. (Revenue÷Impressions)×1,000(\text{Revenue} \div \text{Impressions}) \times 1{,}000 (Revenue÷Impressions)×1,000. For example, $300 in revenue across 150,000 impressions works out to a $2.00 rate. Using an eCPM calculator can save time when comparing performance across multiple ad campaigns or networks. Our eCPM calculator handles this automatically once it’s published, if you’d rather skip the manual math across multiple segments.
What is a good eCPM for mobile apps?
It depends heavily on format and location. In Tier-1 markets like the US, a solid range for banners is $1.00 to $2.50, interstitials $8.00 to $18.00, and rewarded video $18.00 to $45.00+. Emerging markets typically run 60% to 80% lower across every format.
Why is my eCPM dropping?
The most common causes: seasonal budget resets (a post-holiday Q1 slump), a shift in traffic toward lower-paying regions, falling viewability or CTR, a floor price rejecting too many bids, or a technical bug affecting rendering or tracking signal.
What’s the difference between eCPM and CPC?
CPC pays you only when a user clicks. eCPM is the macro-metric that converts click-based (or install-based, or flat-rate) earnings into one standardized rate per 1,000 impressions so that you can compare directly against CPM or CPA deals.
How does in-app bidding improve eCPM compared to waterfalls?
Traditional waterfalls check networks one at a time in a fixed order based on past averages, which routinely misses better real-time offers. In-app bidding forces every connected demand source to bid simultaneously for each impression, so the highest bidder always wins.