

High eCPM and low CPI mean nothing for profitability. Both are gross, averaged, and time-lagged. eCPM hides falling fill rate. CPI hides low-LTV traffic. The only number that matters is clean net revenue: ad revenue minus mediation fees, UA spend, refunds, and invalid traffic. That’s how you know if the studio made money.
If you have ever worked at a game studio, you know this scene. The user acquisition team walks in, grinning, and says CPI is down by 18 percent. Monetization chimes in, proud that eCPM is up in the top three countries. The slide is full of green numbers. Heads nod. But when finance closes the books, the margin is flat or, worse, deep in the red. Nobody fudged the numbers. The dashboards told the truth. Yet somehow, the business did not make a dime.
This is the trap. Studios treat eCPM and CPI like headline numbers, but really, they only tell half the story. Each one is blind to what is happening on the other side of the business. For a CEO or CFO trying to plan next quarter’s budget, or a studio lead fighting for their roadmap, that blind spot can get expensive. The good news is, you can avoid it. Stop asking if eCPM is up. Start asking what your clean net revenue says.
The Dashboard Illusion
eCPM and CPI are great at one thing: turning a messy, complicated business into a single number you can stick on a slide. That is also what makes them dangerous. One number tricks you into thinking there is a simple answer, good or bad. But the truth is, it all depends on what that number leaves out.
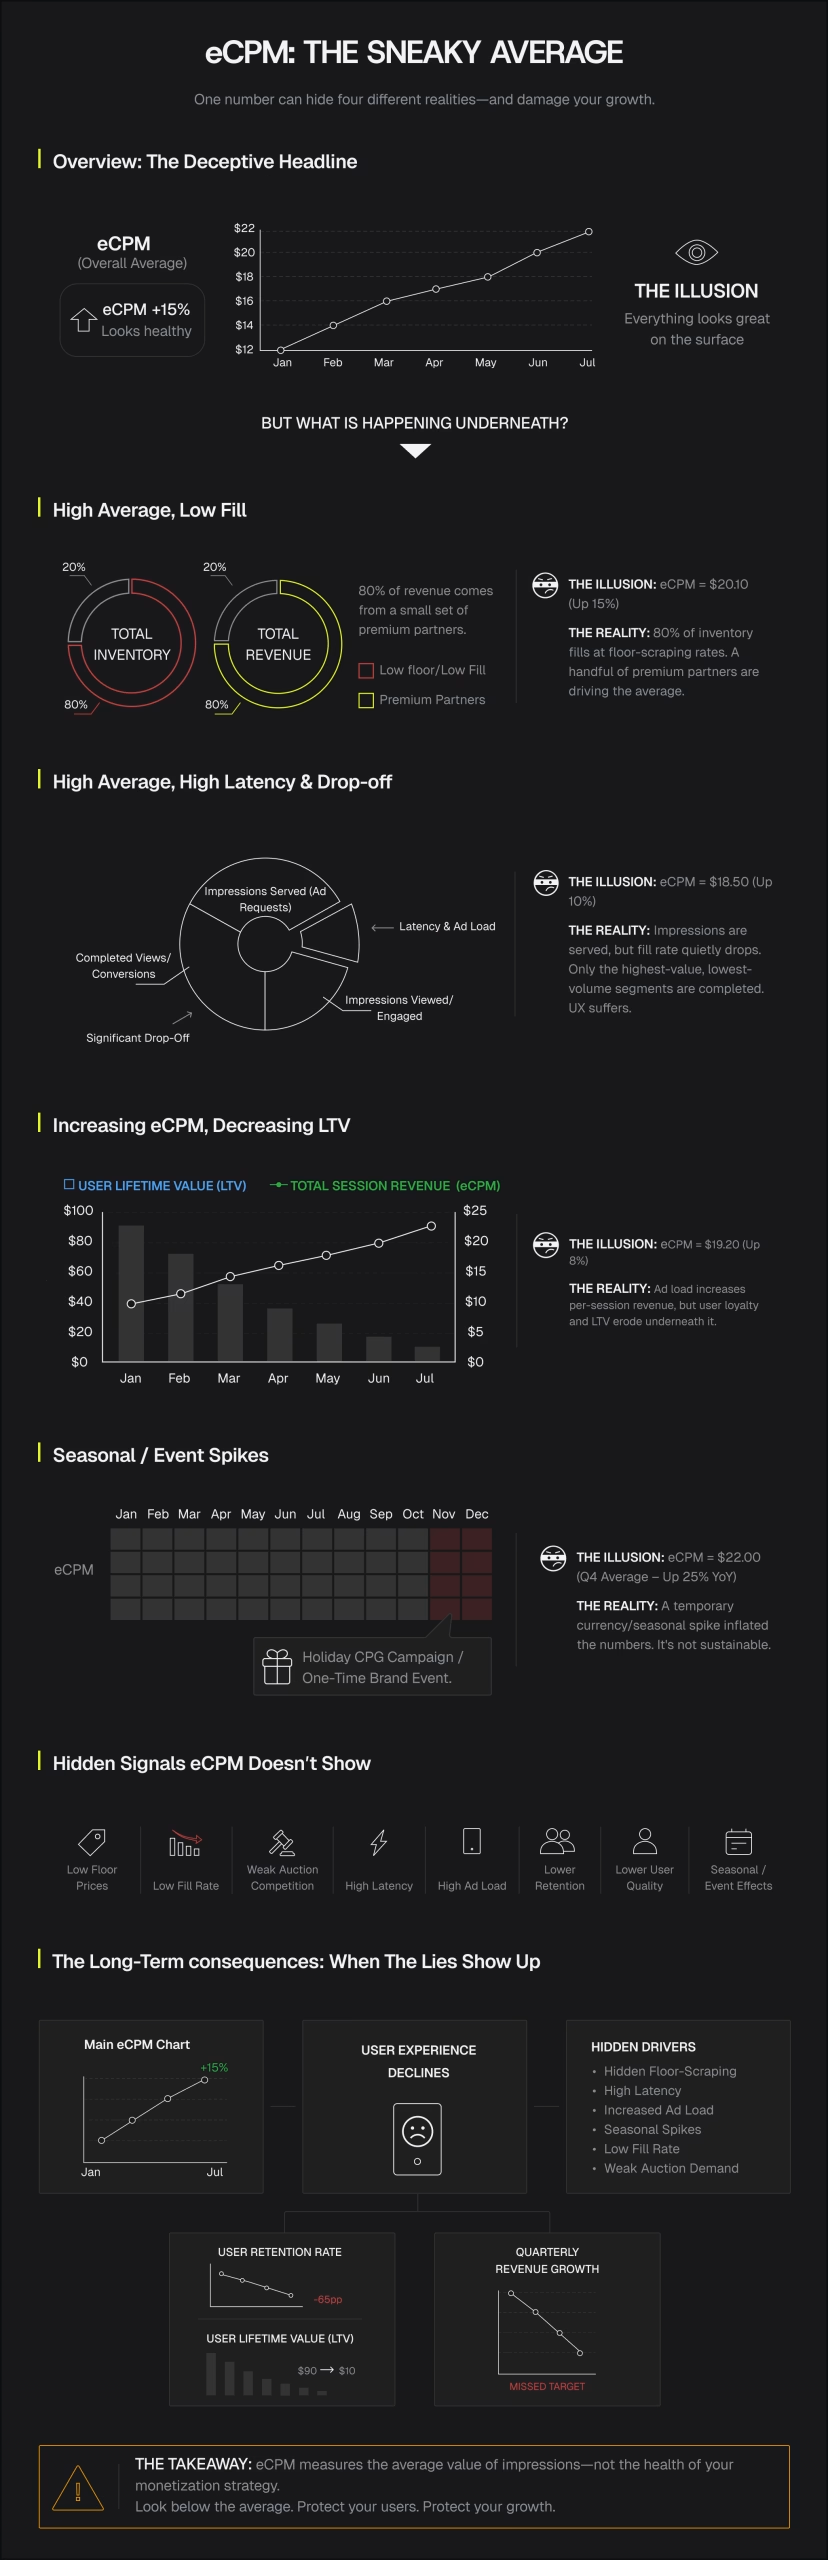
Let’s break down eCPM. You take your total ad revenue, divide by impressions, and multiply by a thousand. It is just an average. And averages are sneaky. They hide what is really happening underneath. Your ad mediation stack might show eCPM going up, but here is what could actually be happening:
- A handful of premium demand partners lift the average while the bulk of your inventory fills at floor-scraping rates.
- Fill rate quietly drops, so the impressions that do get monetized skew toward your highest-value and lowest-volume segments.
- Ad load increases enough that per-session revenue rises even as user loyalty and LTV erode underneath it.
- Currency or seasonal demand increases (holiday CPGs, a single brand campaign) temporarily inflate a subset of your traffic.
None of these details show up in your main eCPM chart. But every one of them will show up later in your retention numbers and your quarterly revenue.
CPI has the same problem, just flipped. When CPI drops, it looks like UA is working better. But it can also mean:
- Your creative or targeting has shifted toward cheaper, lower-intent traffic that installs but doesn’t convert to paying or high-engagement users.
- A network has reclassified traffic sources, changing the mix of organic-adjacent installs counted against paid spend.
- Fraud or incentivized traffic has entered the funnel; installs are real, engagement isn’t.
- You’ve pulled back on premium placements that cost more per install but historically returned better long-term value.
A studio that chases eCPM on one side and CPI on the other, without connecting the dots, can spend a whole quarter making both numbers look better. Meanwhile, actual profit goes the other way. This is not just theory. It is the most common way mobile game publishers and app teams trip up when they have not unified their reporting.
Why “Good Numbers, Bad Quarter” Keeps Happening
Even smart teams get fooled by eCPM and CPI, and it is not because your analysts are not sharp. There are three big reasons why these numbers trip people up.
Different teams with different incentives own the metrics.
- UA teams are measured on CPI and volume. Monetization teams are measured on eCPM and fill rate. Both teams can hit their targets in the same month the studio loses money, because neither metric was designed to measure studio-level profitability; they were designed to measure channel-level efficiency. Optimizing a channel and optimizing the business are related problems, not the same problem.
- Revenue and cost data live in different systems, on different timelines. Ad revenue arrives from ad mediation platform reporting, often with Net-30 or Net-60 payout terms and post-hoc adjustments from DSPs. UA spend is logged in real time from ad networks. By the time “true” ad revenue is reconciled, the CPI decisions it should have informed were made weeks earlier. Studios that make budget calls off same-day eCPM estimates are making calls off a number that will still be revised twice before it’s final.
- Gross numbers ignore the cost of earning them. eCPM is gross. It says nothing about ad serving costs, mediation fees, chargebacks, refunds, or the discount rate on future payouts. CPI is gross too; it says nothing about creative production cost, network platform fees, or the LTV curve of the users it bought. Two studios can report identical eCPM and CPI and have completely different net margins, because the “clean” version of both numbers, the one with real costs subtracted, was never calculated.
To put it simply, eCPM and CPI only tell you how things look at the channel level, before costs, and with a delay. What a CEO or CFO really needs to know is this: after every real cost, and once the numbers are final, how much money did the studio actually keep? And is that number moving in the right direction?
That is the question clean net revenue is meant to answer.
What “Clean Net Revenue” Actually Means
Clean net revenue is not just eCPM with a discount. It is a full rebuild of your P&L, the way a finance team would, using real settled data instead of dashboard guesses. In practice, that means:
- Reconciled, not estimated, ad revenue. Actuals from DSPs and ad networks once Net-X payouts settle, not the same-day SDK estimate that mediation dashboards show in real time.
- Mediation and platform fees subtracted, including the take rate of every ad mediation network in the waterfall or bidding setup, not just the winning bid.
- UA spend attributed to the cohort that actually generated the revenue, not the calendar month the spend occurred in, so a CPI improvement in March that quietly bought low-LTV users shows up correctly against the revenue those users generate in April and May, not as an isolated UA win.
- Refunds, chargebacks, and invalid traffic are removed before the number is called revenue at all.
- Blended across ad formats and IAP, so a studio running a hybrid IAA + IAP model sees one number, not two dashboards that never get compared.
The result is one number that answers the only question that matters to a CEO or CFO. For every dollar you spent to get or serve this group of users, how many dollars did you actually get back, after every real cost? It takes longer to produce than eCPM. You cannot grab it from a live dashboard right after a session. But it is the only number that will hold up in a board meeting.
Why This Has to Be Automated, Not Manually Reconciled
Once a studio spots the eCPM and CPI trap, the first move is usually to build a monthly spreadsheet. Pull the mediation reports, pull the UA spend, pull the payout statements, and try to blend it all by hand. This works for one quarter, maybe two, usually right before someone quits or the studio starts to grow.
Manual reconciliation falls apart for a few big reasons:
- Payout timing never lines up with when you need to make decisions. If you can only figure out net revenue 45 to 60 days later, and you have to do it by hand, you are always making calls about bidding floors, network weighting, or UA budgets using old, gross data. That is exactly the problem clean net revenue is meant to solve.
- The number of demand sources multiplies the reconciliation work. A studio running programmatic ad mediation across a dozen DSPs, several bidding networks, and multiple ad formats has dozens of feeds to normalize, each having its own schema and currency handling. That’s not a spreadsheet problem; it’s a data pipeline problem.
- You need to make yield decisions faster than any human can crunch the numbers. The whole point of knowing your real net revenue is to act on it, changing waterfall order, floor prices, or ad load almost right away. If it takes a finance analyst two weeks to get the number, it might be accurate, but it is useless.
This is the actual argument for automated yield management: not that automation is more modern, but that clean net revenue is only valuable if it’s fast enough to inform the next decision, and only trustworthy at scale if it’s computed the same way every time.
An ad mediation platform that treats net revenue as a first-class, automatically reconciled metric, rather than something bolted on in a BI tool after the fact, closes the gap between “what the dashboard says” and “what finance will confirm six weeks from now.”
That’s the design principle behind CAS.AI’s approach to mediation: yield optimization decisions, which demand source wins in an auction, how floors adjust, and how the waterfall reorders, are made against reconciled, cost-adjusted revenue signals, not raw gross eCPM.
That’s the design principle behind CAS.AI’s approach: yield decisions are made against reconciled, cost-adjusted revenue signals, computed independently of any single demand source. When the platform managing your yield has no stake in which DSP wins, “clean” isn’t just a finance term; it’s a structural property of the auction itself.
A Composite Scenario: Two Green Metrics, One Red Quarter
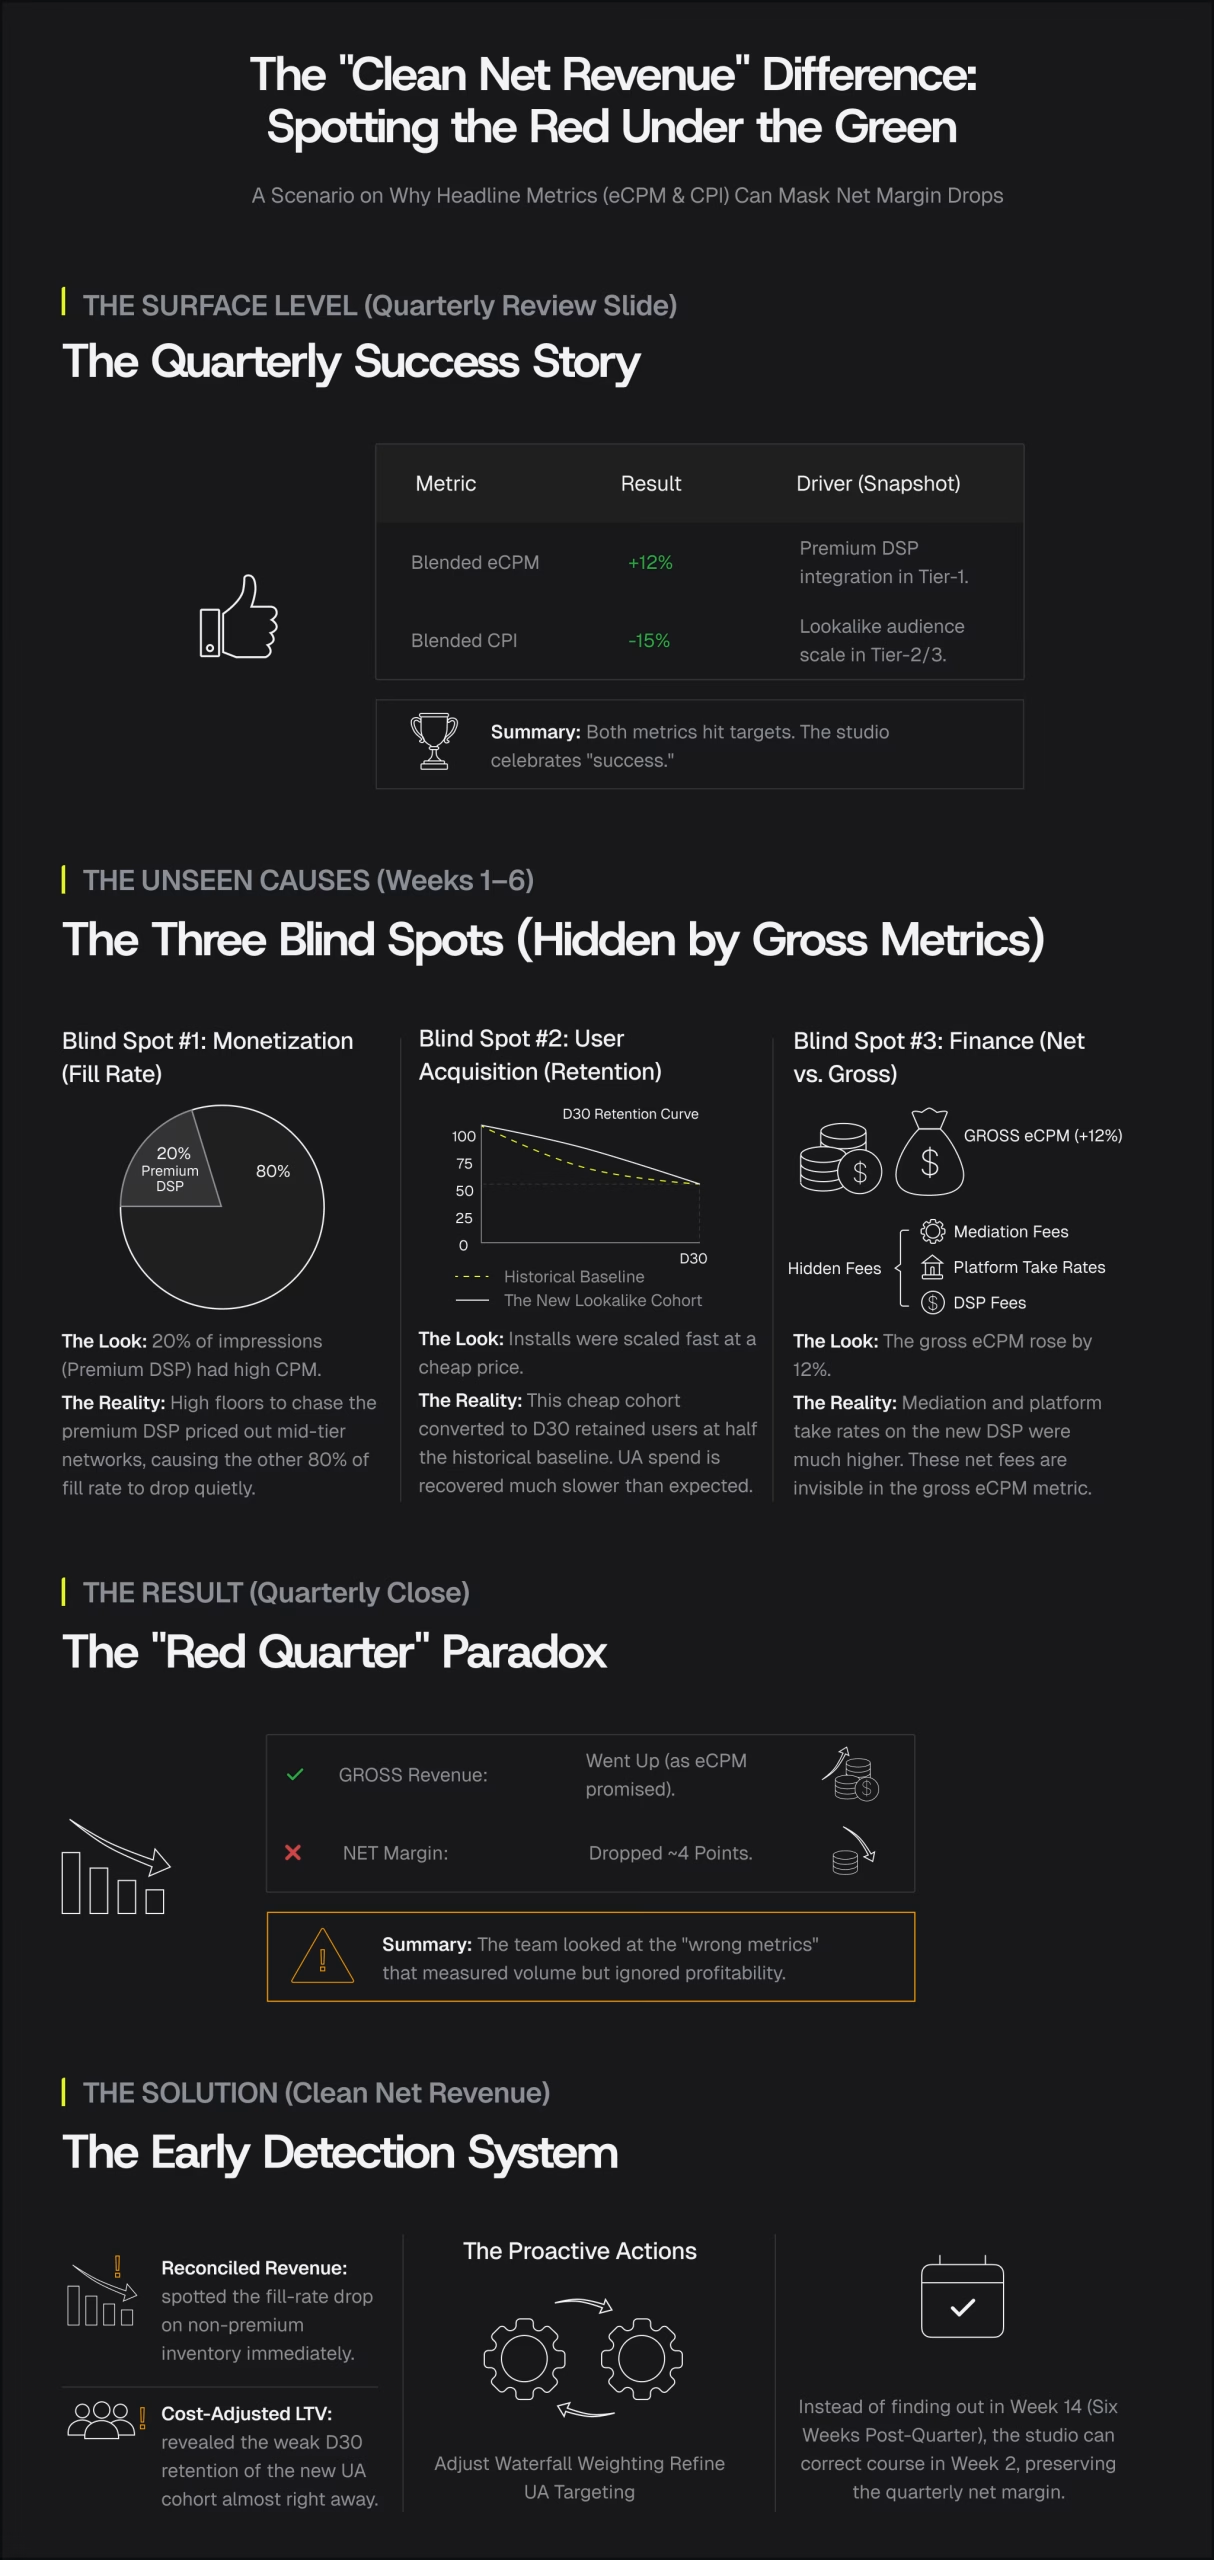
Picture a mid-size hybrid-casual studio running both ads and in-app purchases in a few main markets. Over one quarter:
- Blended eCPM rises 12%, driven mostly by a new premium DSP integration that wins a growing share of impressions in Tier-1 geos.
- Blended CPI falls 15%, driven by a UA team shifting spend toward a cheaper lookalike audience that scales fast in Tier-2 and Tier-3 markets.
- Both numbers hit the studio’s targets. The quarterly review slide is green from top to bottom.
Underneath those two numbers, three things were also true, none of which showed up until finance closed the books six weeks later:
- The premium DSP’s share of impressions was large in dollar terms but small in volume; it lifted the blended average while fill rate on the remaining 80% of inventory quietly slipped, because floors set to court the premium demand priced out several mid-tier networks that used to fill that inventory reliably.
- The cheaper Tier-2/Tier-3 audience installed at a great CPI but converted to Day-30 retained users at roughly half the rate of the studio’s historical baseline, which meant the UA spend behind those installs was being recovered over a much longer, and less certain, horizon than the CPI figure implied.
- Mediation and platform take rates on the new premium DSP integration were higher than the legacy setup, which was invisible in the eCPM number because eCPM is gross by definition.
So what happened? Gross revenue went up, both headline metrics were green, but net margin for the quarter dropped by about four points once UA spend was matched to the right cohorts and mediation fees were taken out. Nobody on either team messed up their own numbers. The real problem was, they were looking at the wrong metric.
This is the kind of mess clean net revenue is built to catch early, in week two, not week fourteen. An automated yield system that reads reconciled, cost-adjusted revenue would have spotted the fill-rate drop on non-premium inventory and the weaker cohort LTV almost right away. That gives you time to adjust waterfall weighting and UA targeting before the quarter is over, not after.
A Framework for C-Level and Studio Leads
If you’re a CEO, CFO, or studio lead trying to tell whether your studio has an eCPM/CPI blind spot, four questions cut through most of it faster than a metrics audit.
- Can you produce net revenue per user cohort, not just gross revenue per day? If your reporting only slices by calendar date, you cannot see whether last month’s CPI win bought users who monetize well over 90 days or users who churn in a week. Cohort-based, LTV-adjusted views are mandatory for any studio spending real UA budget.
- Does your finance team’s revenue number match your mediation dashboard’s revenue number? If there’s a constant gap, and there almost always is, somewhere between 5% and 20% depending on payout terms and fee structures, that gap is the size of your blind spot. It’s the difference between what the mediation platform reports “live” and what actually lands, net of fees and adjustments.
- Who owns the shared metric, not eCPM, not CPI, but blended net margin per user? If the answer is “nobody, it comes out in the quarterly close,” you’re optimizing two halves of the business independently and hoping they add up. They usually don’t.
- How fast can you act on a net revenue signal once you have it? If the answer is “next sprint” or “next quarter,” the automation gap is costing you more than the reconciliation gap. Yield decisions, floor pricing, waterfall order, network weighting need to move at close to the speed the auction itself moves, or the studio is always optimizing last quarter’s business.
You do not need to tear down your whole stack to answer these questions. Think of them as a quick checkup. If your studio can answer all four with confidence, you are already ahead. If not, you just found, in five minutes, exactly where your next quarter’s margin is leaking.
What Changes When Yield Is Managed on Clean Net Revenue
The real change is not as dramatic as it sounds, but it sticks around longer than any one-time audit. Once you start making yield decisions—like which networks get which impressions, how you move floors, how you tune ad load-based on reconciled, cost-adjusted revenue instead of just gross eCPM, three things usually happen:
- UA and monetization stop arguing past each other. Both teams are held against the same number, so a CPI win that damages downstream monetization shows up as a shared miss, not a UA success story sitting next to a monetization complaint.
- Budget talks get shorter. The CFO does not have to dig into whether eCPM going up actually means anything. The net revenue number already covers the things that would have made it meaningless.
- Yield tuning becomes proactive, not reactive. Instead of finding out at the end of the month that a network’s fill rate crashed or a DSP’s fees crept up, an automated system keeps adjusting waterfall weighting based on the real net picture, just like the best ad mediation platforms are built to do.
You do not have to toss out eCPM or CPI. They are still handy for daily channel tuning. But do not let either one pretend to answer the real question: is this business actually making money? There is only one honest answer, and it is the number finance signs off on, not the one that pops up live on a dashboard.
The Bottom Line
High eCPM makes it look like monetization is working. Low CPI makes it look like UA is working. Both can be true for one channel and still be wrong for the studio as a whole. Neither metric was built to answer the real profitability question. They only show a piece of the story, on their own timeline, before costs are counted.
For a CEO or CFO evaluating a mobile game publisher’s health, or a studio lead defending a roadmap against the board, the only defensible number is clean net revenue: reconciled, cost-adjusted, cohort-attributed, and current enough to act on. Getting there manually is possible for a quarter. Getting there reliably, at the speed yield decisions actually need to move, is what automated yield management is for.
Studios that make this shift stop asking if eCPM went up. They start asking if the business kept more money than it spent to make it. And they finally get an answer they can bring to the board with confidence.
Key Takeaways
- eCPM and CPI are gross, channel-level, time-lagged metrics; neither one measures studio-level profitability on its own.
- A rising eCPM can mask falling fill rate, an unhealthy ad load increase, or a small premium-demand skew hiding weak performance across the bulk of inventory.
- A falling CPI can mask a shift toward low-LTV traffic, misattributed installs, or invalid traffic entering the funnel.
- Clean net revenue reconstructs the P&L from settled data: reconciled ad revenue, mediation fees subtracted, UA spend attributed to the cohort that earned the revenue, refunds and invalid traffic removed.
- Manual reconciliation of net revenue works for a quarter; it breaks down as demand sources and reporting timelines multiply, which is the real case for automated, real-time yield management.
- Four diagnostic questions reveal a studio’s blind spot fast: cohort-level net revenue visibility, the gap between mediation dashboards and finance actuals, ownership of a shared blended-margin metric, and the speed of acting on a net revenue signal.
FAQ
Is eCPM a useless metric? No, it’s a useful operational signal for day-to-day channel and placement tuning. It becomes misleading only when it’s treated as a proxy for overall studio profitability, which it was never designed to measure.
What’s the difference between gross ad revenue and clean net revenue? Gross ad revenue is what a mediation dashboard reports in real time, before fees, before payout reconciliation, and without cost attribution. Clean net revenue subtracts mediation and platform fees, reconciles against settled DSP payouts, attributes UA spend to the cohort that generated the revenue, and removes refunds and invalid traffic.
Why can’t finance match this monthly by hand? Manual reconciliation typically works for a single reporting cycle but doesn’t scale as the number of demand sources, ad formats, and payout timelines multiplies, and even when accurate, it’s usually too slow to inform the yield decisions (floor pricing, waterfall order, network weighting) that need it most.
How does an independent ad mediation platform differ from a dual-role operator in this context?
An independent ad mediation platform works differently from one that also acts as a bidder in its own auctions. Some platforms run the auction and also throw their own bids into the mix. CAS.AI’s model keeps those roles separate by design. As an independent layer, it does not have a horse in the race. The decisions about yield and revenue come straight from the real auction results. This approach removes any built-in reason to tilt the auction. The focus stays on what CAS.AI actually does.