Mobile App Monetization Metrics Glossary: What to Track, How to Calculate It, and What to Do Next
Open up your ad dashboard and you are staring at a mess of numbers. Sure, they are all technically right, but good luck figuring out what you are supposed to do wiFeffeth them.
So here is how we break it down. Each metric answers a real question: what is my inventory worth, what is each user worth, am I spending wisely to get them, and where does the money leak out in the auction? For every metric, you get the formula, a quick example, and the mistake we see most often.
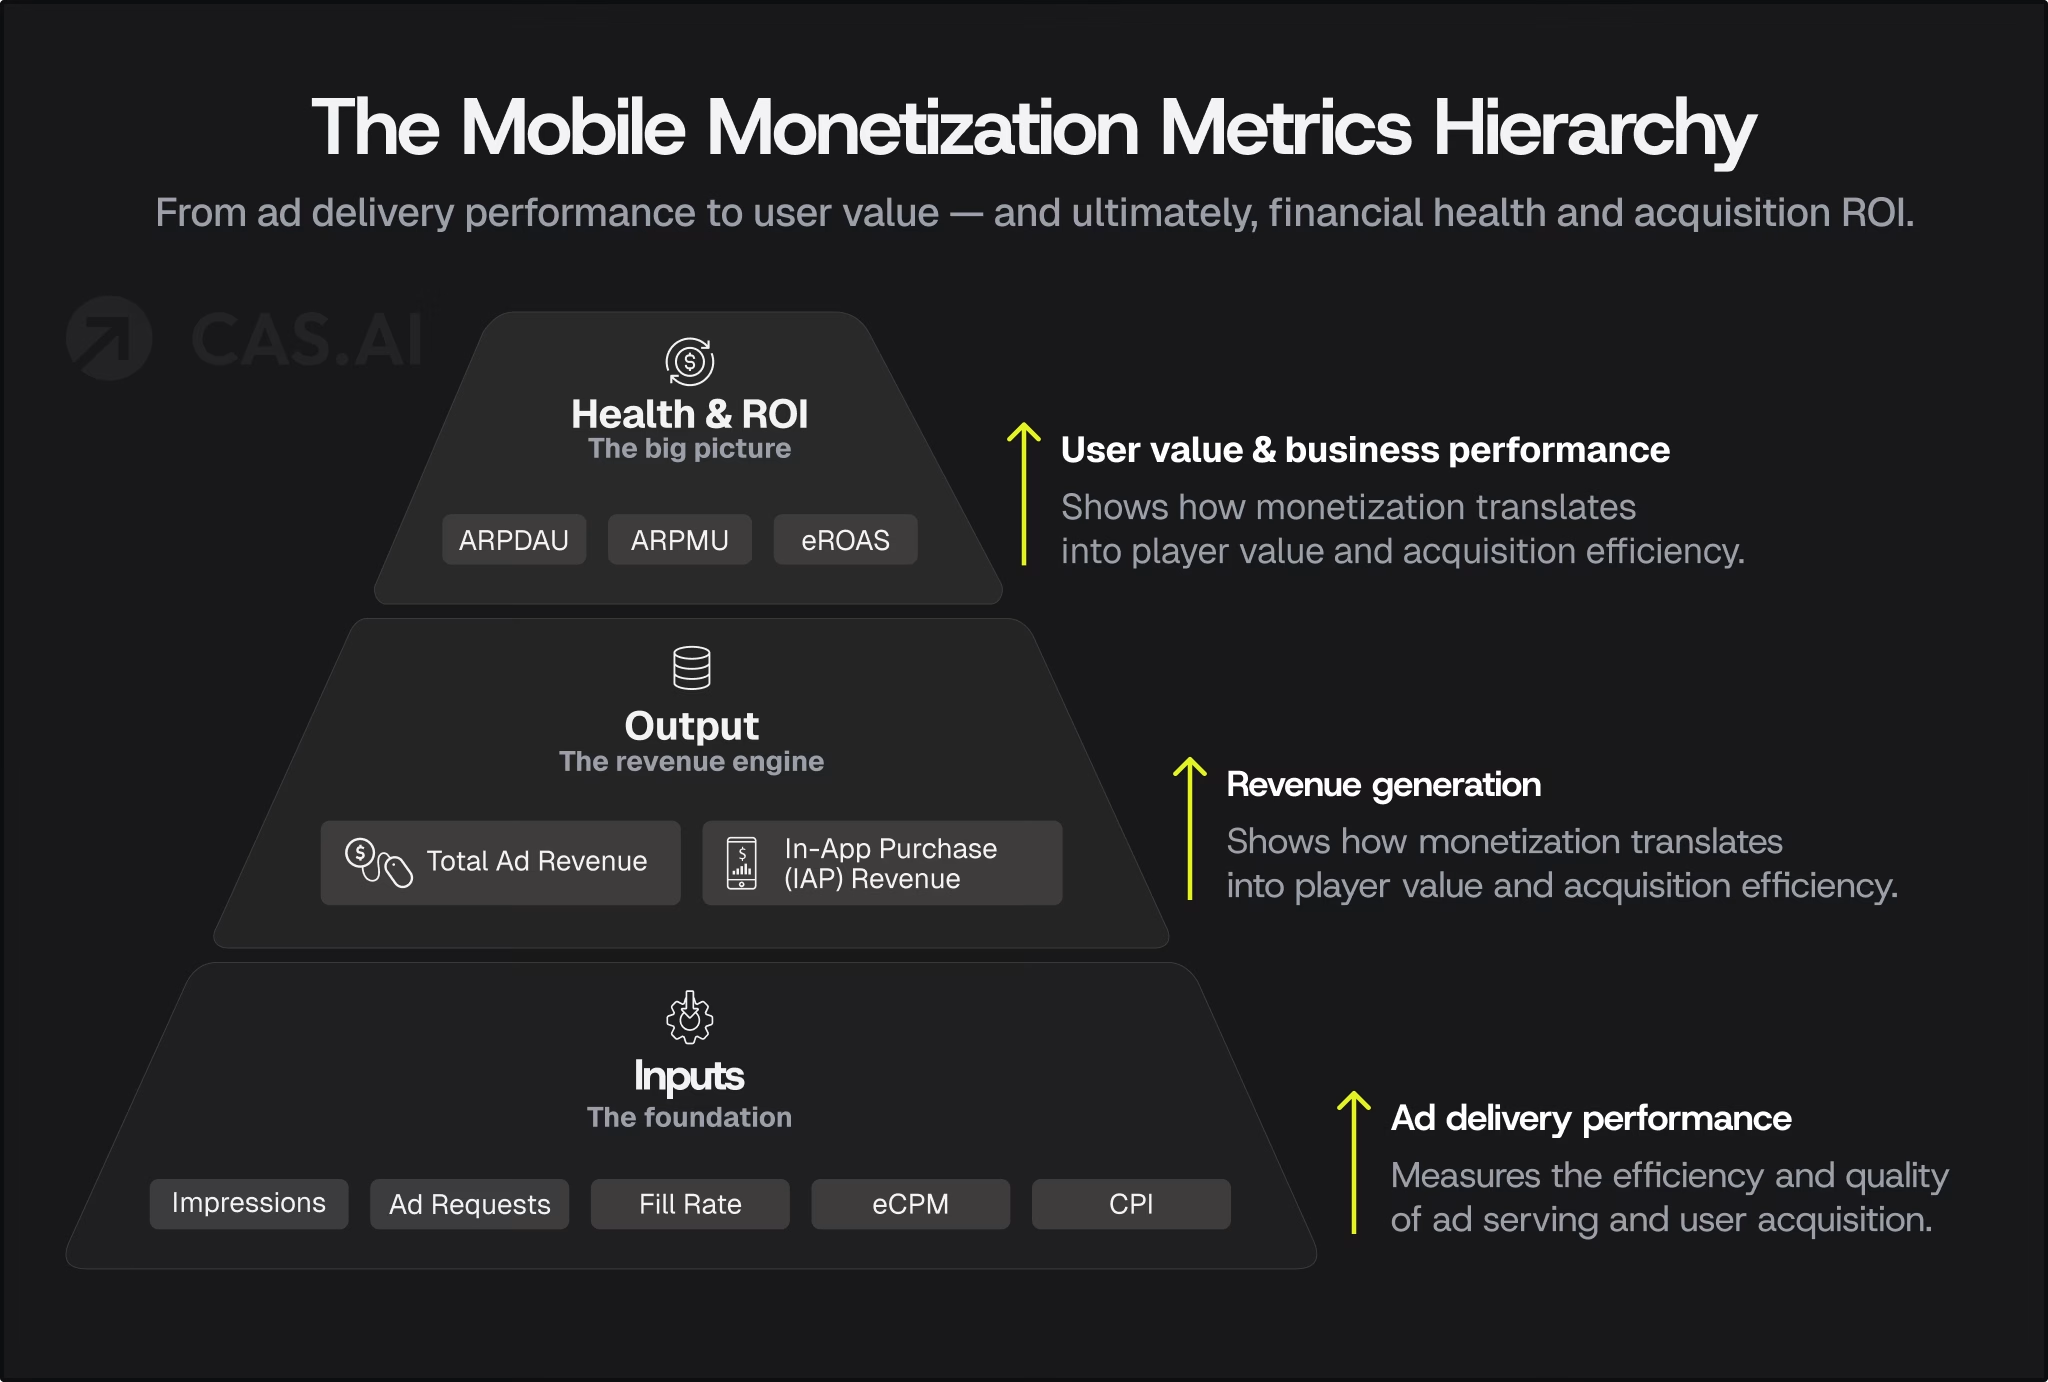
By the end, you will know which numbers actually matter, how to crunch them, and where to look first when your revenue just does not make sense.
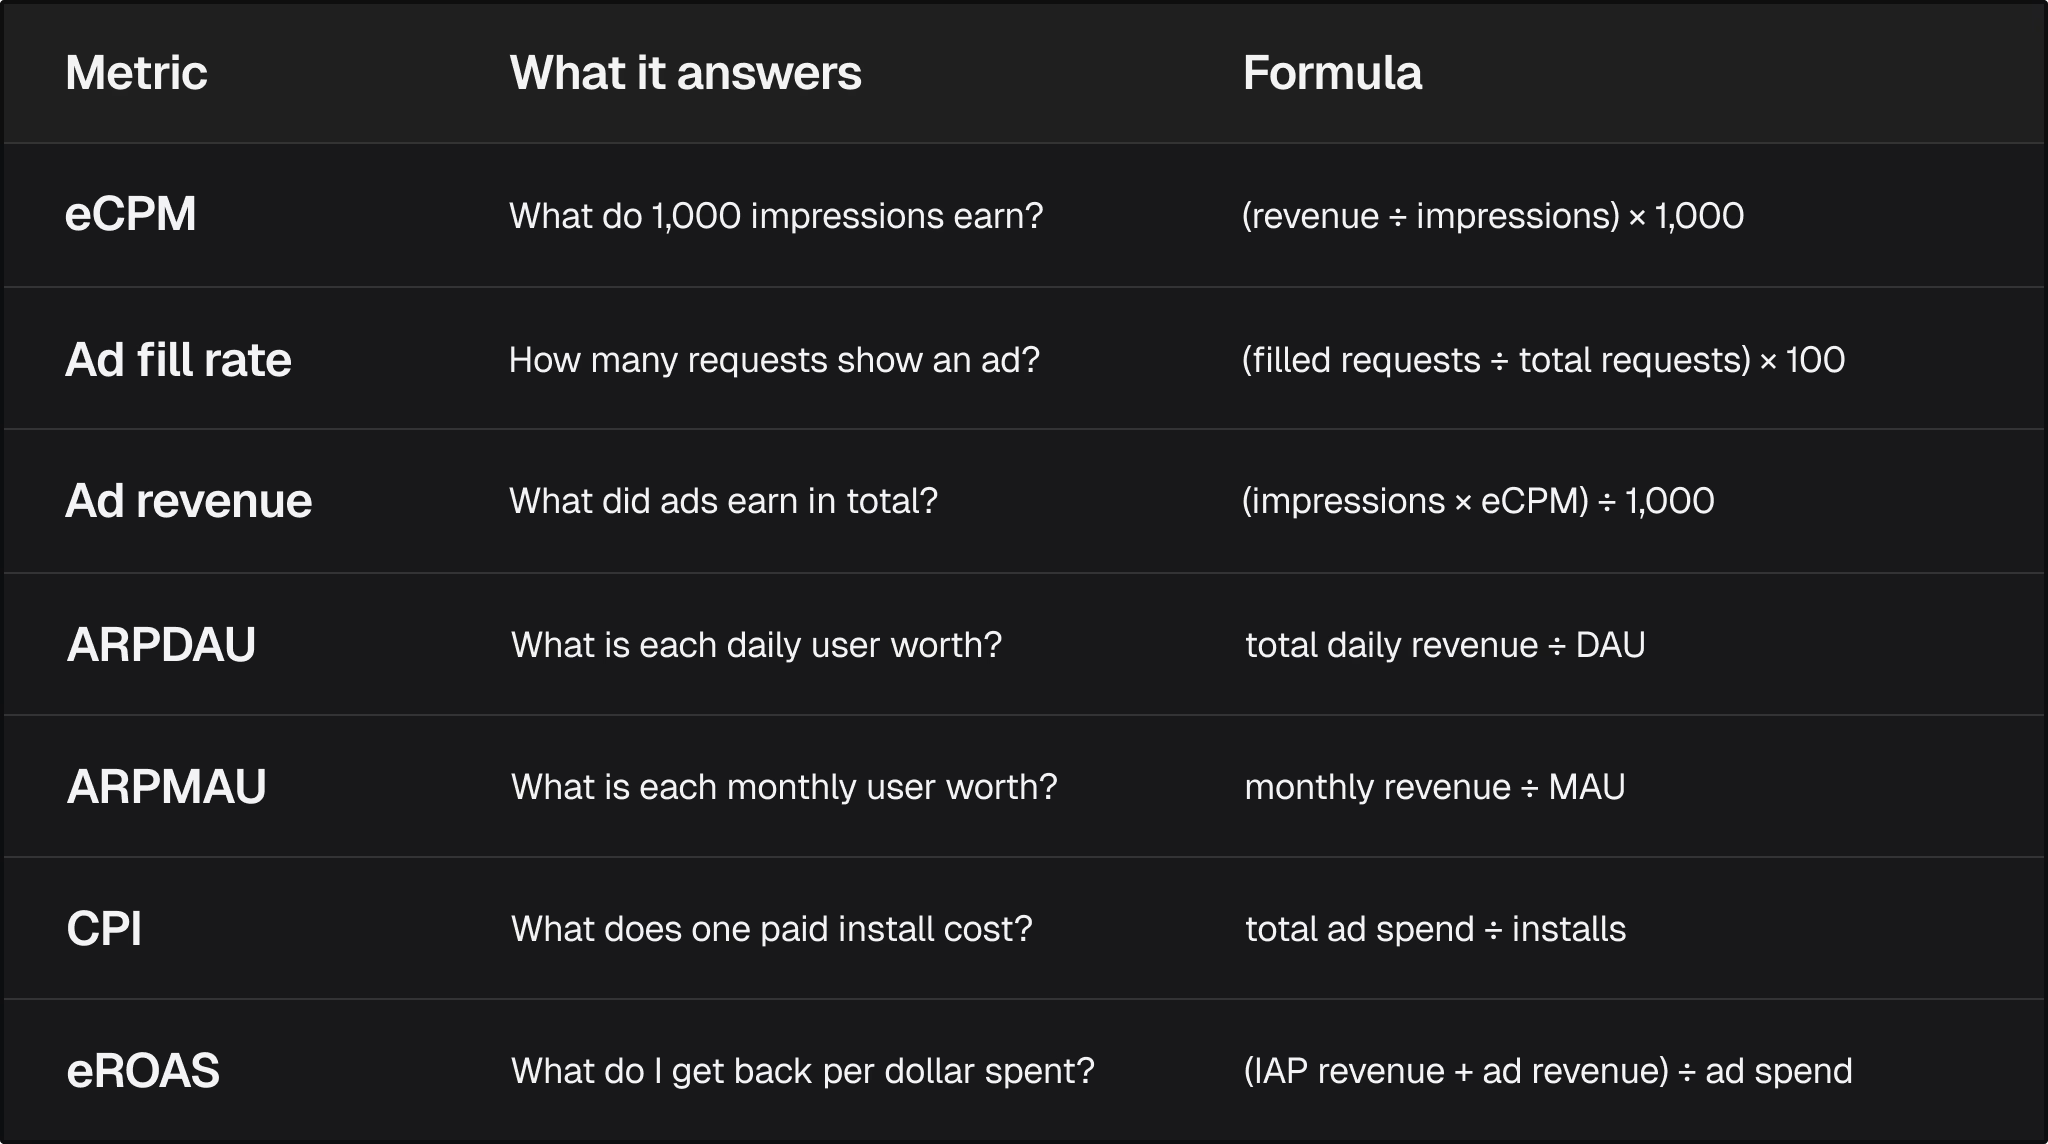
Quick reference
Part 1. What is your inventory worth?
eCPM (effective cost per mille)
eCPM is your bottom line for every 1,000 ad impressions, no matter if you are paid by click, install, or just for showing the ad. The full name is effective cost per mille, with mille just meaning thousand. It is the number that lets you compare apples to apples across all your networks and formats.
Formula: eCPM = (revenue ÷ impressions) × 1,000
Example: $450 from 120,000 impressions gives an eCPM of $3.75.
Common mistake: Comparing eCPM across formats or geos as if they were equal. A rewarded video in the US and a banner in a low-tier market are different products. Segment first, then compare.
Ad fill rate
Ad fill rate is the percentage of ad requests that actually show an ad to your users.
Formula: Fill rate = (filled requests ÷ total ad requests) × 100
Example: 80,000 filled out of 100,000 requests is an 80% fill rate.
Common mistake: Chasing a high eCPM and ignoring fill rate. The two only matter together. Take two setups, measured per 1,000 ad requests:
- eCPM $10 at 40% fill earns $4.00
- eCPM $7 at 90% fill earns $6.30
The so-called cheaper setup brings in over 50% more. If your eCPM looks great but your revenue is stuck, fill rate is usually the first place to look.
Ad revenue
Ad revenue is the total income your app earns from showing ads. It is the simplest metric of all, and every other number eventually rolls up into it.
Formula: Ad revenue = (impressions × eCPM) ÷ 1,000
It is your sanity check. If revenue jumps or drops, the cause is almost always impressions or eCPM, and you can usually spot which one in under a minute.
Part 2. What is each user worth?
ARPDAU
ARPDAU (average revenue per daily active user) tells you how much you make from each daily active user, counting both ads and in-app purchases.
Formula: ARPDAU = total daily revenue ÷ DAU
Example: $2,400 in daily revenue from 40,000 DAU gives an ARPDAU of $0.06.
This is your best daily health check for a live app. Always track it by cohort, country, and platform, because a single blended number can hide the segment that is actually slipping.
ARPMAU
ARPMAU (average revenue per monthly active user) is the same idea stretched over a month instead of a day.
Formula: ARPMAU = monthly revenue ÷ MAU
Example: $48,000 from 300,000 MAU gives an ARPMAU of $0.16.
Use ARPMAU when your daily numbers bounce around too much, for example in apps where people show up mostly on weekends.
Retention and LTV: the context behind the averages
Per-user revenue only tells half the story. Two longer-term metrics show whether that revenue lasts:
- Retention rate is the share of users who keep using your app after install (commonly checked at day 1, day 7, and day 30). Retained users see more ads and make more purchases.
- Lifetime value (LTV) is the total revenue an average user generates over their whole time in your app. Compare it with CPI to know whether acquisition pays off.
When you test anything that raises ARPDAU, check retention right after. Revenue that costs you users is not growth.
Part 3. Are you spending well to get them?
CPI (cost per install)
CPI is what you pay to get each new install through paid ads.
Formula: CPI = total ad spend ÷ installs
Example: $5,000 for 2,500 installs gives a CPI of $2.00.
Common mistake: Treating CPI as a quality score. It is not. An install that costs $0.80 but never sees an ad is worse than one that costs $2.00 and does. Always read CPI next to what those users go on to earn.
eROAS
eROAS (effective return on ad spend) measures how much you get back for every dollar you spend on ads, counting both in-app purchases and ad revenue.
Formula: eROAS = (IAP revenue + ad revenue) ÷ ad spendF
Example: $3,000 IAP + $2,200 ad revenue on $4,000 spend gives an eROAS of 1.3, or 130%.
Why it matters: Most teams only look at ROAS from in-app purchases. If your app makes money from both ads and purchases, you are missing the full picture, and you might even switch off campaigns that are actually profitable.
Part 4. Which formats earn, and where?
Metrics tell you how much you earn. Ad formats decide where that money comes from.
Interstitial ads
Interstitial ads are full-screen ads shown at natural breaks, such as between levels. People often search for interstitial ads CPM or how much interstitial ads pay. There is no single number: payouts depend on geo, platform, app category, and demand, and interstitials typically sit well above banners in eCPM. Measure your own interstitial ad revenue by segment instead of leaning on averages.
Placement is what decides whether they hurt retention. Keep them at natural pauses, and cap frequency.
Rewarded video ads
Rewarded video ads are opt-in videos watched in exchange for an in-app reward, such as extra lives or in-game currency. Because users choose to watch, they tend to be better tolerated, which makes them a strong fit for games and apps with a clear virtual economy.
Native ads
Native ads are built to match the surrounding content, such as in-feed units that look like the rest of your interface.
Native ads vs banner ads: Banners are fixed-size units that sit on the screen and are easy to ignore. Native ads adopt your app’s own design, so they tend to feel less intrusive and can hold attention better. The trade-off is more design and integration work. Native advertising platforms and ad networks supply the demand, and mediation lets you run several of them side by side.
Offerwall
An offerwall is a menu of tasks or offers, such as trying another app or completing a survey, that users complete for virtual currency. It works best in apps with a currency to spend, and it is opt-in by design.
The rule we use
Compare eCPM and ARPDAU for each format, then check how those users stick around. If a format boosts ARPDAU but your day-7 retention drops, you are borrowing revenue from the future.
Part 5. How the auction actually runs
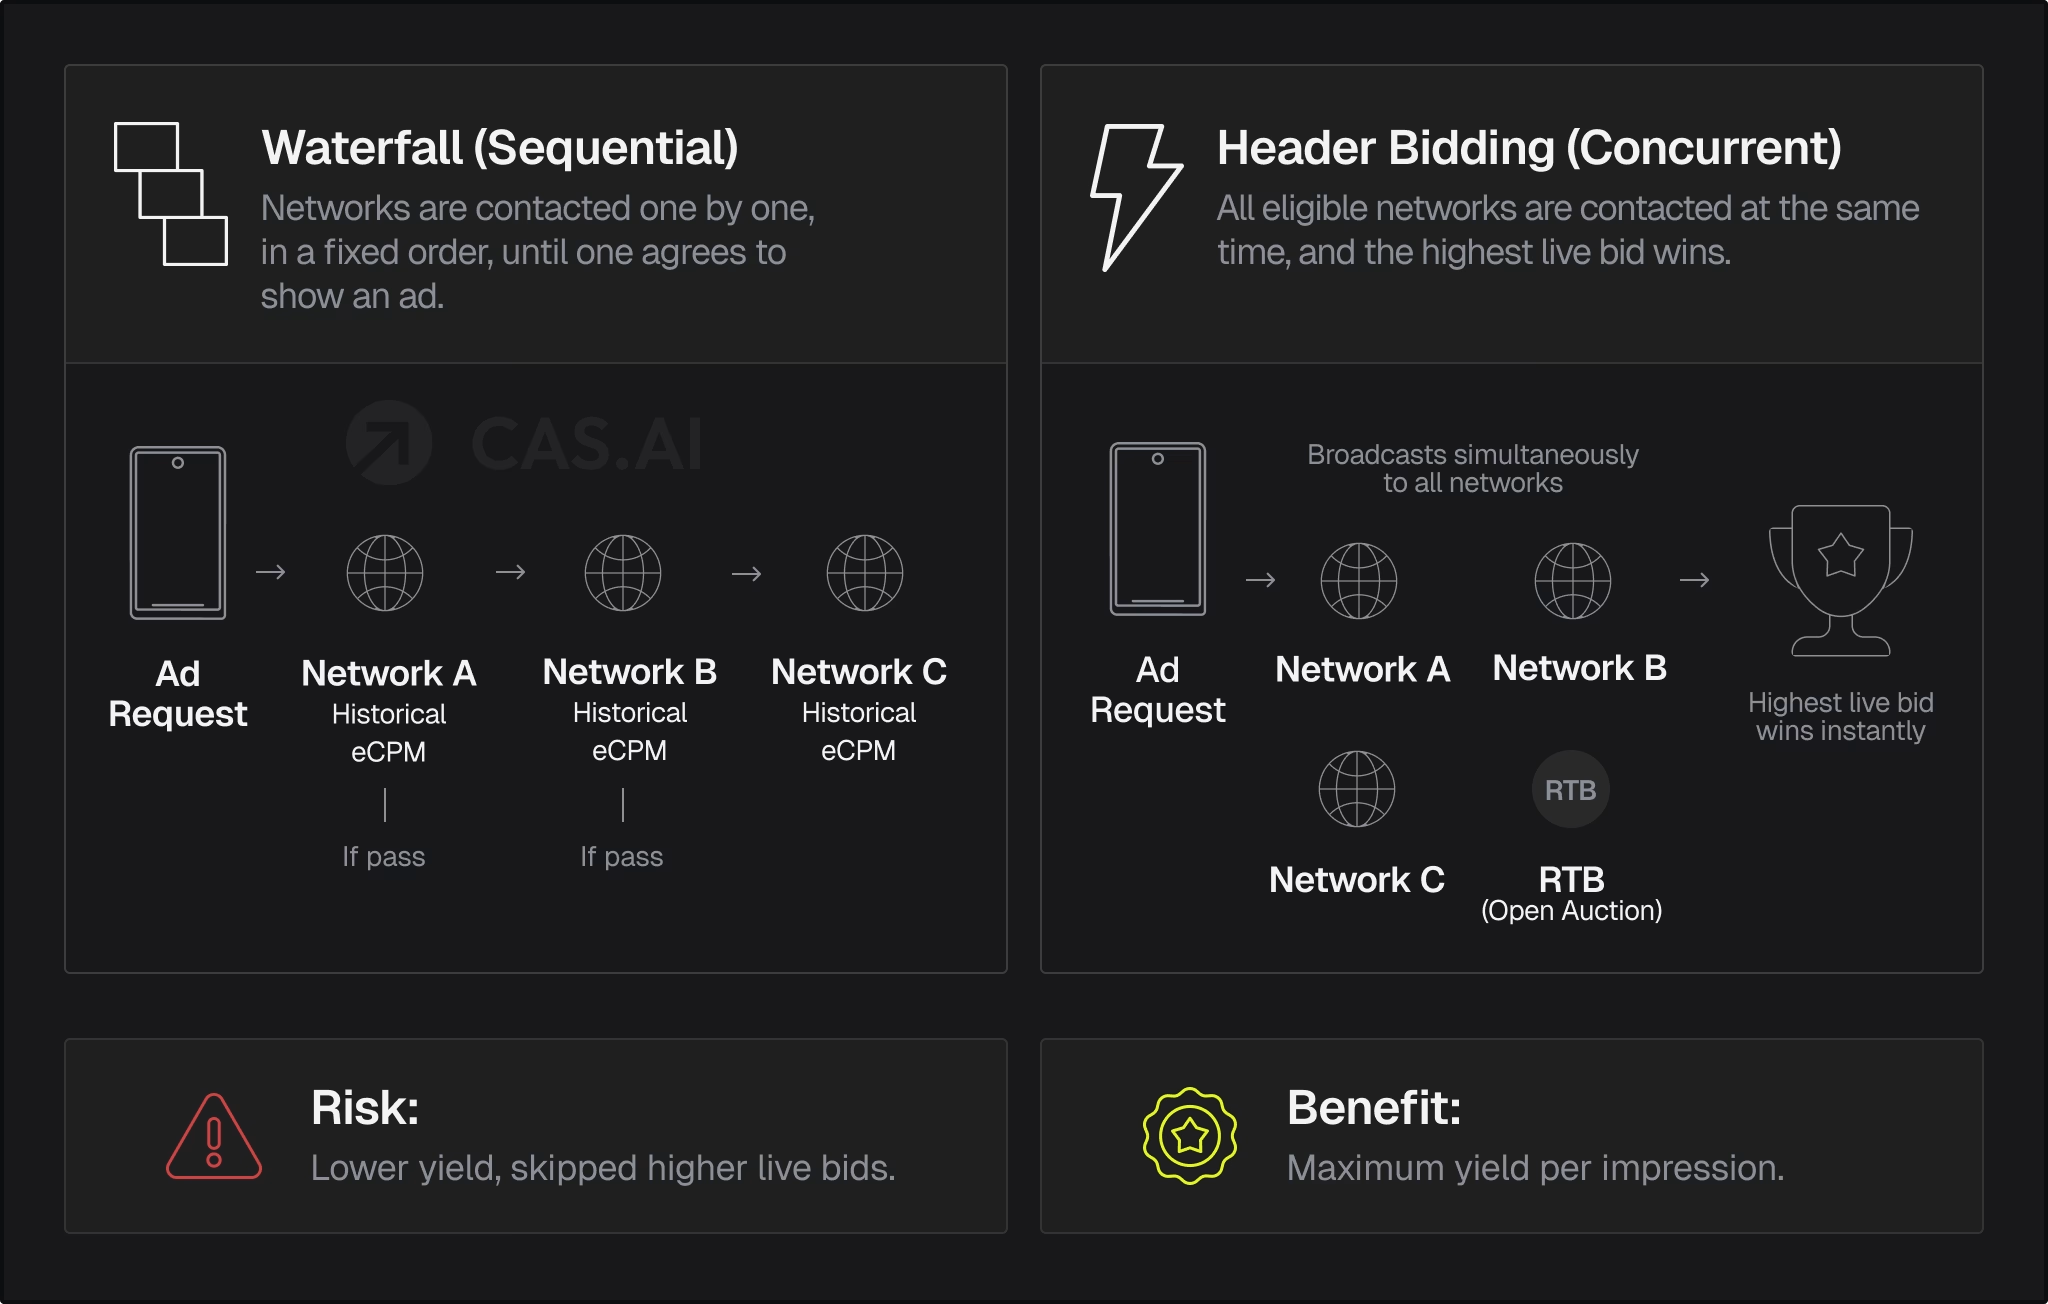
Most of the time, if your revenue is off, the problem is in the auction. It is the engine behind every number above.
Ad mediation
What is ad mediation? Ad mediation is the software layer between your app and multiple ad networks. It runs one auction per impression instead of sending traffic to a single network.
Learn more about CAS.AI Mediation.
Mediation can work in two ways.
Ad waterfall
In an ad waterfall (often called waterfall monetization), networks get the impression one after another, ranked by historical eCPM. It is simple, but it relies on past averages, so a network that would have paid more today can be skipped.
Header bidding
Header bidding, also known as in-app header bidding on mobile, lets multiple demand sources bid on the same impression at the same time, before the server call. The highest live bid is subject to floor prices, not the highest historical average.
Real-time bidding (RTB)
Underneath both sits real-time bidding: each impression is sold individually, in milliseconds. On mobile (mobile RTB), an RTB platform connects your inventory to many advertisers at once. The two sides of that market are:
- DSP (demand-side platform): where advertisers buy.
- SSP (supply-side platform): where publishers sell.
DSP vs SSP in one line: the DSP works for the buyer, the SSP works for the seller, and the auction happens between them.
app-ads.txt
There is one more piece of plumbing you should not skip. What is app-ads.txt? It is a plain text file on your developer site that lists who is allowed to sell your ad space. Without it, buyers cannot be sure your inventory is real, and many will either pay less or not bid at all.
A weekly routine
You do not need to stare at every metric every day. Run this checklist once a week:
- Check ARPDAU by country and platform. Look for the segment that changed, not just the overall average.
- Check fill rate by network and by format. If revenue drops, fill rate is usually the fastest clue.
- Compare eCPM for each format. Watch for any format that is slipping while the others stay steady.
- Recalculate eROAS for your last three user acquisition cohorts. Include ad revenue, not just in-app purchases.
- Confirm app-ads.txt is live and up to date after any network change.
- Review your mediation setup. If you are still using a traditional waterfall, switch to a hybrid model by testing bidding on a portion of your traffic.
If something looks off, work backward: start with revenue, then check eCPM or impressions, then fill rate, format, network, and finally how your auction is set up.
Where to go from here
Metrics only matter if you can act on them. If you see low fill, a flat eCPM, or revenue that does not add up, the problem is usually hiding in your mediation setup. At CAS.AI, we act as your Growth Operator: we don’t just supply the tech; we work with you to turn these metrics into decisions, from fixing fill rate to testing bidding and scaling revenue.
Are you a developer or studio looking to grow ad revenue? Explore CAS.AI Mediation, see how publishing with CAS.AI works, or get started today.