

How to Align UA and Monetization for Maximum ROAS
If you want your UA and monetization work to actually pay off, start by tracking ad revenue for each user. Looking at IAP (In-App Purchase) alone just does not cut it. Fold ad revenue into your RoAS, ARPU, and LTV for every user. When both teams see the same numbers, you stop tripping over each other and finally see what your returns really look like.
The gap that’s quietly draining your RoAS
Two teams. One P&L. Almost no shared data.
This is the usual scene inside most mobile app and game companies. The UA manager is out there buying installs, adjusting bids, and watching CPI and D7 retention (Day Seven Retention). The monetization manager is tangled up in waterfalls, eCPM floors, and ARPDAU. Both know their stuff. But when the quarter ends, the RoAS numbers still do not add up.
The problem is not effort. It is that nobody can see the full picture. UA teams chase IAP (In-App Purchase)) revenue and take a wild guess at ad revenue, because that is all the dashboard gives them. Monetization teams watch eCPM and fill rate, but have no idea which campaign or creative brought in the users who actually make money. Both sides are flying half-blind, making decisions that look good in isolation but end up clashing.
That is the gap. Closing it is the smartest thing you can do if you want your app to grow without burning cash on campaigns that only look good on paper.
RoAS definition: Mobile app context.
And why the “simple” version is misleading
RoAS, or Return on Ad Spend, is usually defined as:
RoAS = Revenue generated by a cohort ÷ Ad spend to acquire that cohort
That sounds simple, but the trick is what you count as revenue. Most UA dashboards only show in-app purchase revenue because that is easy to track through the app store. Ad money is an entirely different beast. It is hard to pin ad revenue to a single user or campaign. Most of the time, it just lands as one big lump sum from your ad network, with no details.
For a hybrid-monetization app or a free-to-play game with a heavy ad-supported layer, this is a serious blind spot. If 40-70% of your revenue comes from in-app advertising and your RoAS calculation only counts IAP (In-App Purchase), you’re not measuring RoAS; you’re measuring a fraction of it.
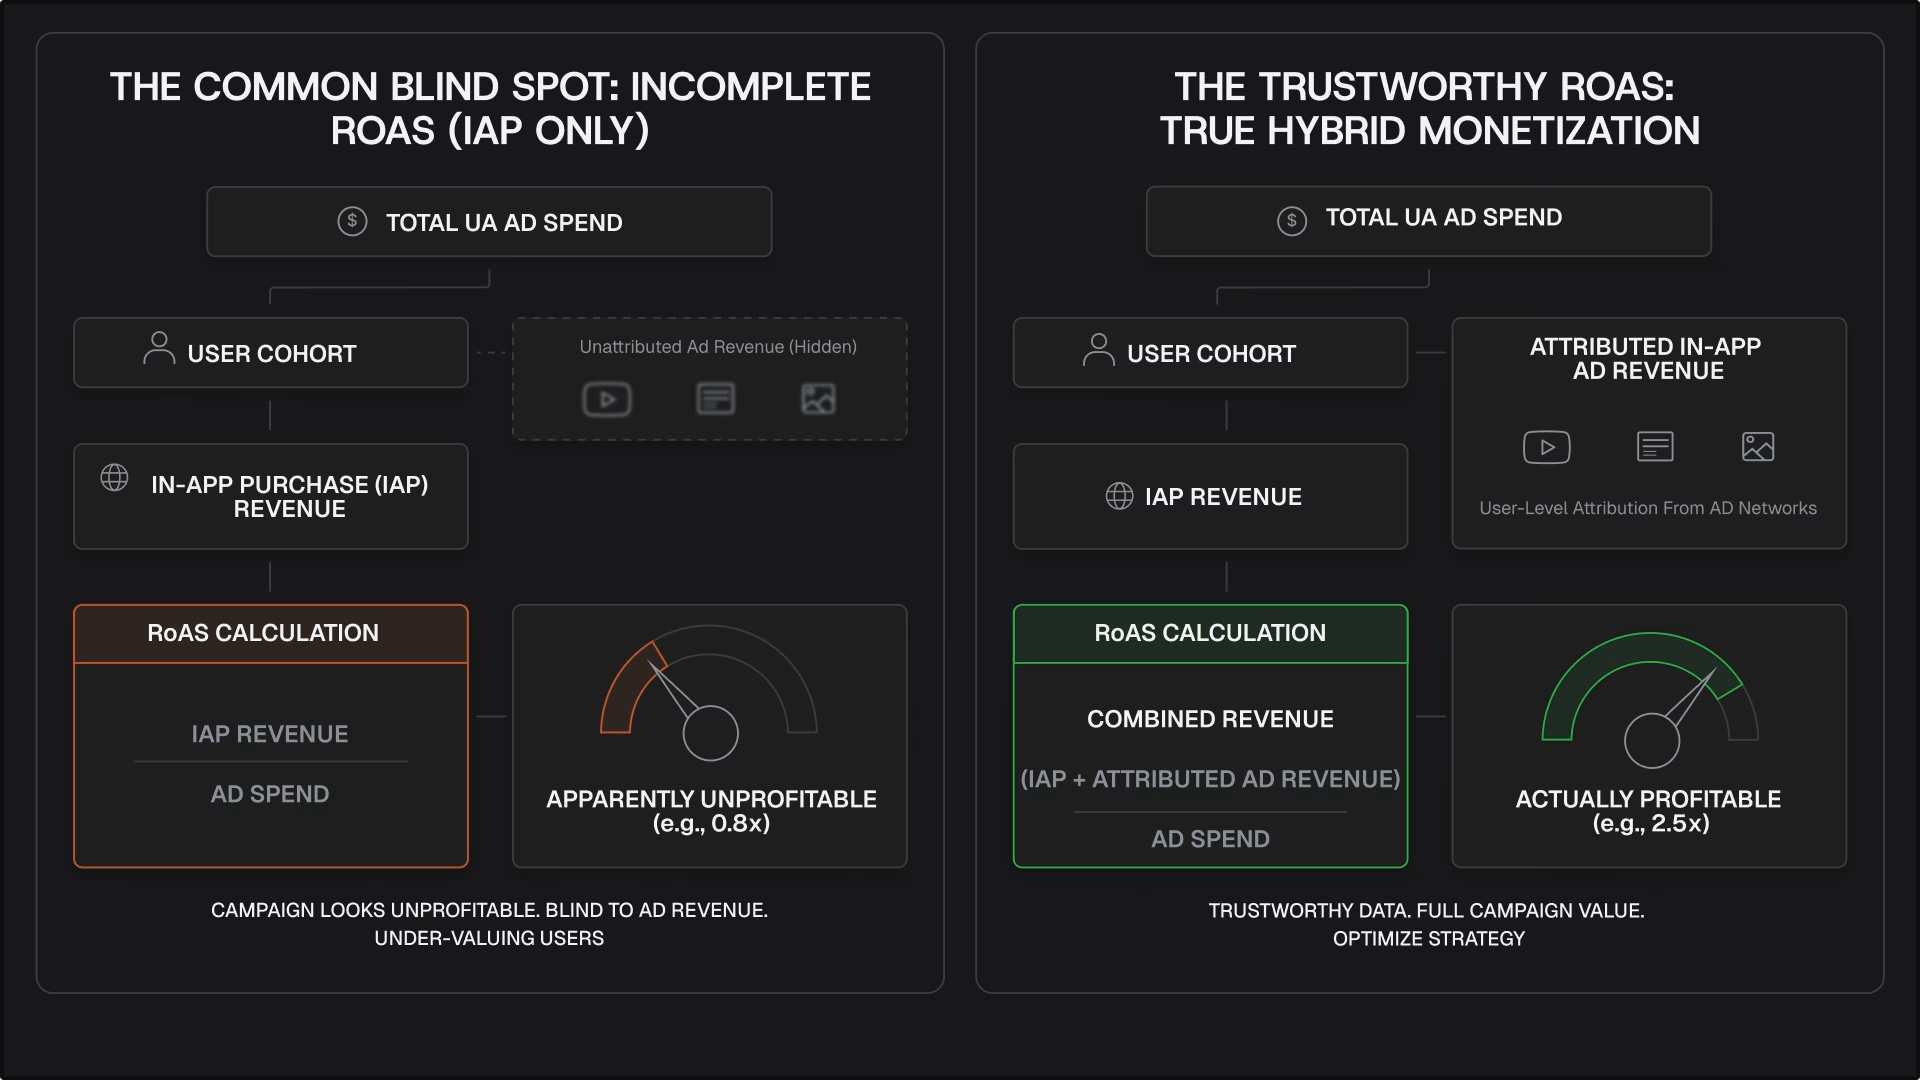
Campaigns that look unprofitable by IAP-only (In-App-only Purchase) RoAS might actually be your best performers once ad revenue is properly attributed. And campaigns that look great on IAP (In-App Purchase) RoAS might be propped up entirely by a handful of high-value payers, masking a much thinner ad-revenue contribution from the rest of the cohort.
Working RoAS definition for mobile apps:
RoAS = (IAP (In-App Purchase) revenue + attributed in-app ad revenue) ÷ UA spend, measured per cohort, per campaign, per creative, over a defined LTV window.
When you add user-level ad revenue, RoAS stops being a wild guess and becomes a number you can actually trust.
A quick illustration: same install, two different RoAS stories
Let us put some numbers on this. Picture two UA campaigns for the same mid-core game. Both spend ten thousand dollars, and both bring in a thousand installs at ten bucks a pop. On a dashboard that only counts purchases, this looks like the stronger campaign.
Campaign B does not do well on IAP (In-App Purchase), only bringing in $1,800 by day 30. That is just eighteen percent RoAS if you only look at purchases. But the users from Campaign B love watching ads. They watch forty percent more rewarded videos per session than Campaign A’s users. When you count ad revenue, this group brings in $6,200 by day 30. Now the blended RoAS is eighty percent.
If you only look at IAP (In-App Purchase), Campaign A seems like the winner. But with blended, user-level data, Campaign B is almost twice as good. Under the old way, you would have shut down Campaign B and missed out. This is why user-level ad revenue attribution matters. It stops you from killing off the campaigns that are actually working, just because your reports are missing half the story.
What “good RoAS” actually looks like in mobile games
There is no magic RoAS number that works for everyone. Any article that tells you otherwise is missing the point. What matters is the shape of your RoAS curve, not just one number.
A few grounding reference points UA teams commonly use:
- D0 RoAS of 100%+ (spend recouped on install day) is rare and usually only achievable with hyper-casual or rewarded-ad-heavy formats with very fast monetization cycles.
- D7 RoAS in the 20-40% range is a common milestone for mid-core and casual titles that expect payback over 60-180 days.
- D30-D90 RoAS trending toward 100%+ is the real target for most sustainable UA campaigns, the point where the cohort has paid for its own acquisition and everything after is margin.
- Full LTV RoAS (D180+ or D365) is where hybrid-monetization games and long-tail retention titles actually prove out; judging them on D7 or D30 alone will make good campaigns look like failures.
The variable that moves this curve more than almost anything else is ad monetization efficiency, eCPM, fill rate, and impression density per active user. Two campaigns with identical CPI and identical D7 retention can post very different RoAS curves purely because one cohort responds better to rewarded video and interstitials than the other. Without user-level ad revenue attribution, you can’t see that difference; you can only see the average, which hides it.
Why UA and monetization stay siloed (even at good companies)
This is not about teams dropping the ball. It is a structural problem built into how most stacks work:
- Different tools, different owners. UA runs on MMPs and ad networks’ own dashboards. Monetization runs on a mediation platform’s dashboard. The two rarely share a join key that lets you connect a specific user’s acquisition source to their ad-revenue behavior.
- Different reporting cadences. UA optimizes daily or even hourly on CPI and installs. Monetization reviews eCPM trends weekly or monthly, aggregated across the whole user base. By the time ad-revenue data would be useful for a UA decision, the campaign has already moved on.
- Different incentives. UA is measured based on cost-effectiveness and volume. Monetization is measured on ARPDAU and fill rate. Neither KPI, on its own, forces anyone to ask “which UA source produced the users generating this ad revenue?”
- SDK and data-layer gaps. Attributing ad revenue at the impression level, to a specific user, and then joining that back to the install source and campaign requires an ad revenue attribution pipeline most teams haven’t built, because it’s genuinely harder to wire up than IAP (In-App Purchase) tracking.
None of these problems are impossible to fix. They are just why the gap is there in the first place, not because anyone messed up.
The fix: user-level ad revenue attribution
This is the key that turns a blended, backward-looking guess into a real tool you can use to make decisions right now.
User-level ad revenue attribution means every ad impression, every rewarded video, interstitial, and banner is tied back to the individual user who saw it. That user is tied back to the UA campaign, ad network, creative, and even placement that acquired them. Instead of a single aggregate ad revenue number for your whole app, you get:
- Ad revenue per user, per day
- Ad revenue rolled up by acquisition campaign and creative
- A blended LTV figure (IAP (In-App Purchase) + ad revenue) that updates as the cohort matures
- RoAS that reflects total monetization, not just the transactional half of it
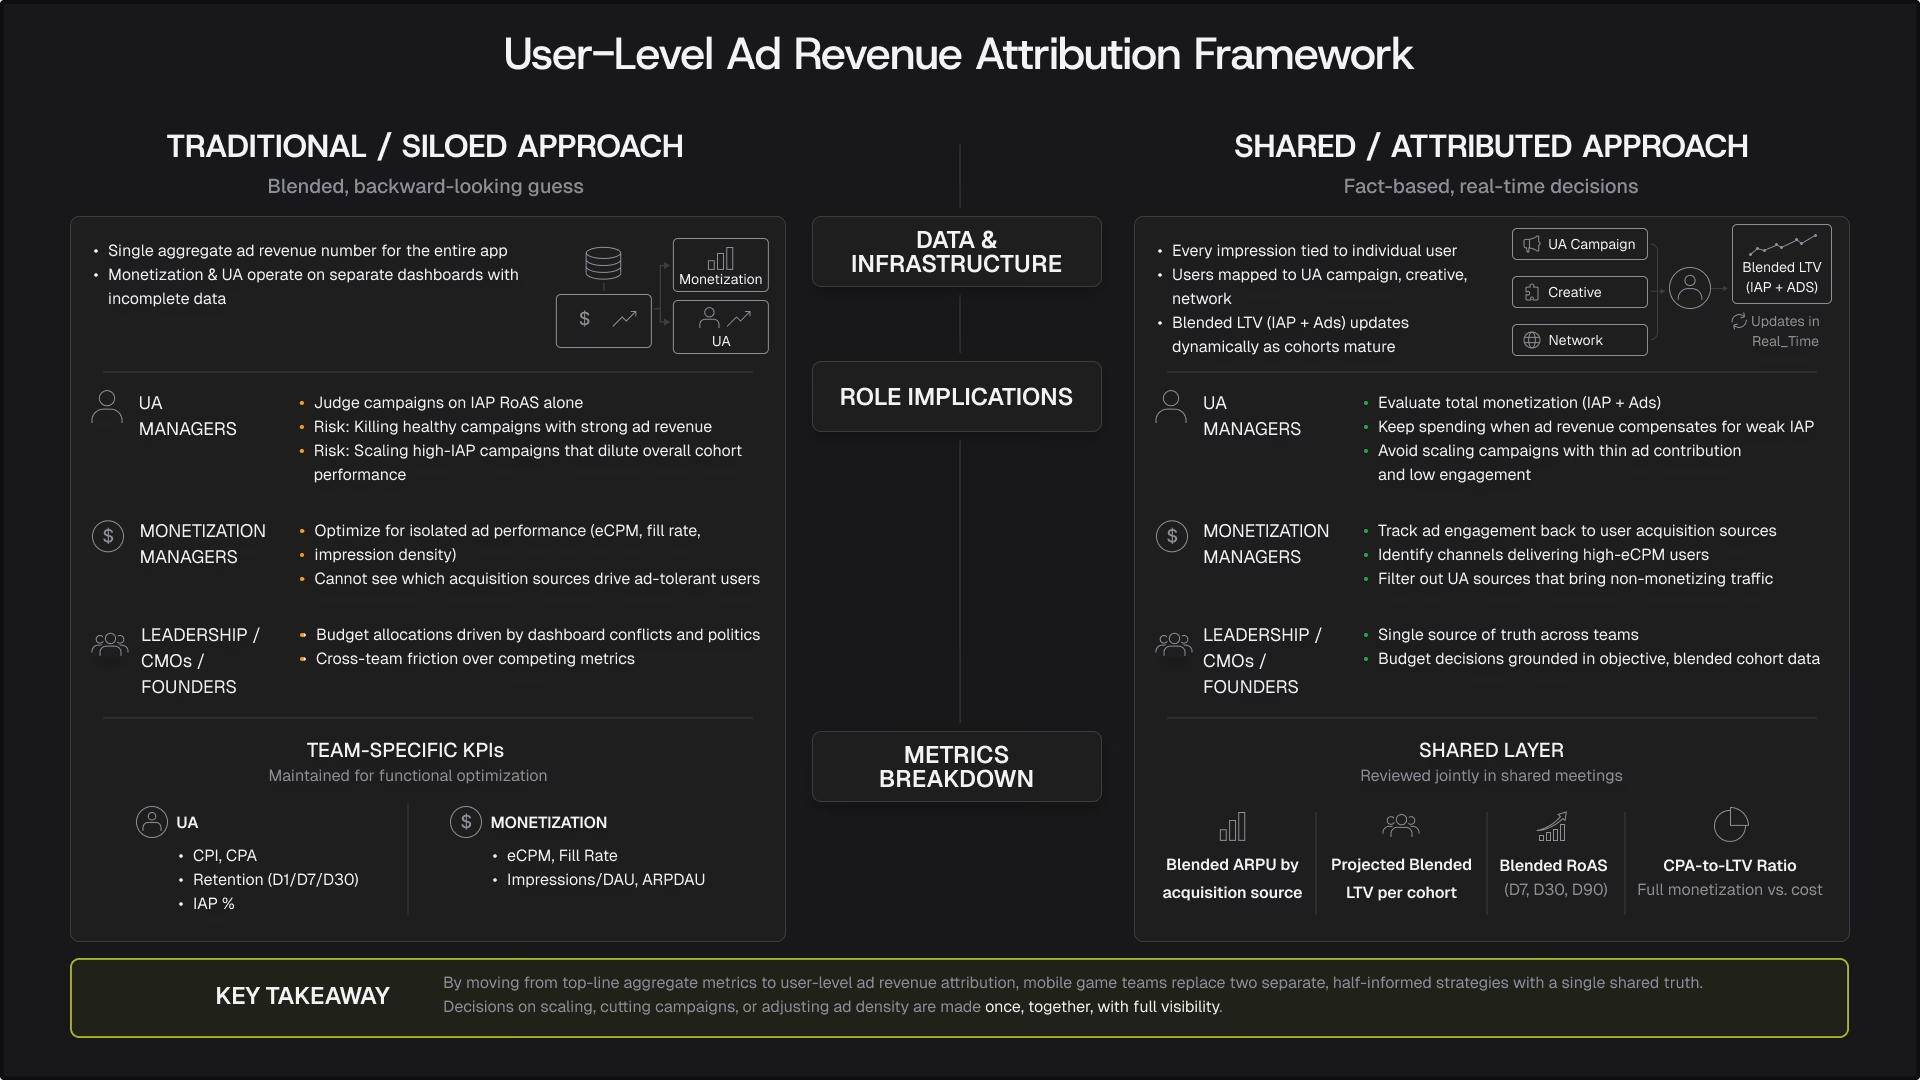
For UA managers, this changes what “optimize the campaign” means. Instead of stopping a campaign because its IAP (In-App Purchase) RoAS looks weak at D7, you can see that its ad-revenue RoAS is strong and its blended curve is actually healthy, and keep spending into it. Instead of scaling a campaign because IAP (In-App Purchase) RoAS looks great, you might see the ad-revenue contribution is thin, and the cohort is smaller or lower-engagement than it appears, avoiding a scale-up that would have diluted overall performance.
For monetization managers, it closes the loop from the other side. Now you can see which UA sources bring in users who actually watch ads, tolerate ad frequency, and keep eCPM strong, versus sources that bring in lots of users who do not really bring in revenue.
For CMOs and founders, this is the layer of transparency that turns budget talks into real conversations based on facts, not politics. When both teams look at the same blended, user-level number, the question of whether to cut a campaign is no longer a battle between two dashboards. It is just a clear answer.
UA metrics mobile games teams should track together (not separately)
Bringing UA and monetization onto shared metrics doesn’t mean replacing either team’s core KPIs; it means adding a shared layer both teams review together.
Metrics UA managers already track:
- CPI (Cost Per Install)
- CPA (Cost Per Action, a completed tutorial, a specific level, a first purchase)
- D1/D7/D30 retention
- IAP (In-App Purchase) conversion rate
Metrics monetization managers already track:
- eCPM by network and ad format
- Fill rate
- Impressions per DAU (impression density)
- ARPDAU
The shared layer that closes the gap:
- ARPU (Average Revenue Per User), blended across IAP (In-App Purchase) and ads, segmented by acquisition source
- LTV (Lifetime Value), projected from blended ARPU curves per cohort, not just IAP (In-App Purchase) curves
- Blended RoAS, by campaign, creative, and network, at defined maturity windows (D7, D30, D90)
- CPA-to-LTV ratio, which tells you not just what a user expenses, but whether that cost is justified once their full monetization value is counted
When both teams look at this shared layer together, in the same meeting, using the same data, decisions stop being made twice with half the facts. Instead, you make the call once, and you get it right.
CPA in mobile marketing: the metric that ties spend to value
CPA (Cost Per Action) is where UA and monetization teams have the most natural common ground, and where the gap does the most damage when it’s left unaddressed.
In mobile marketing, CPA usually gets defined around a UA-friendly action: completing a tutorial, reaching level 5, making a first purchase. It’s a useful bidding target because it’s fast to measure. But CPA on its own says nothing about value. A $3 CPA campaign optimizing for “reached level 5” can bring in users who churn immediately after that milestone and never watch another ad. A $6 CPA campaign targeting the same milestone might bring in users who stick around, engage with rewarded video for weeks, and generate far more LTV per dollar spent.
The fix is the same one that runs through this entire guide: don’t evaluate CPA in isolation. Pair it with blended LTV per user acquired at that CPA. A campaign’s true efficiency isn’t “how cheap was the action”; it’s “how much blended revenue did the resulting user generate relative to what they cost.” Once ad revenue is assigned at the user level, CPA and LTV can finally be compared on the same basis, campaign by campaign.
LTV and user acquisition: closing the loop
LTV modeling for user acquisition has traditionally leaned on IAP (In-App Purchase) curves because they’re the cleanest data available early in a user’s lifecycle. But for any app or game with a meaningful ad-supported revenue stream, an IAP-only (In-App-Only Purchase) LTV model will systematically undervalue certain cohorts, often the same lower-spend, higher-engagement cohorts that are cheapest to acquire and most durable over time.
Feeding blended LTV (IAP (In-App Purchase) + attributed ad revenue) into your UA bidding and budget-allocation models is the single change most likely to reveal underpriced growth opportunities: campaigns and audiences that look mediocre on a narrow definition of value and look excellent once the full picture is counted.
RoAS optimization for UA campaigns: a practical sequence
Once user-level ad revenue attribution is in place, here’s the sequence that actually moves RoAS, in the order most teams should tackle it:
- Re-baseline your campaigns with blended RoAS. Before making any spend decisions, re-run your last 60-90 days of campaign data through blended RoAS instead of IAP-only RoAS. Expect surprises; campaigns you’d written off may look very different once ad revenue is properly attributed to them.
- Segment by creative and placement, not just campaign. Two creatives in the same campaign, targeting the same audience, can produce meaningfully different ad-engagement behavior downstream. Attribution at the creative level tells you which specific assets are bringing in users who actually watch rewarded ads and tolerate interstitials, information that pure IAP (In-App Purchase) tracking will never surface.
- Feed blended LTV back into your bidding. If your UA campaigns are bidding to a target CPA or a target RoAS, that target should be built on blended LTV, not IAP (In-App Purchase) LTV alone. This is the single highest-impact change most teams can make, because it directly changes what your bidding algorithm optimizes toward. Bidding algorithms are only as good as the value signal you give them.
- Set maturity windows appropriate to your monetization mix. Ad-heavy hybrid games commonly show a slower but longer RoAS curve than pure-IAP (In-App Purchase) titles, because ad revenue accrues steadily with engagement instead of in occasional purchase spikes. Judging these titles on a D7 window built for IAP-driven games will systematically undervalue them. Match your reporting window to how your monetization mix actually behaves.
- Close the loop with monetization on a shared cadence. Put UA and monetization in the same review, on the same data, on a fixed schedule, weekly for active campaigns, monthly for strategic review. The goal isn’t just visibility; it’s a standing forum where “this campaign’s blended RoAS just dropped” or “this source’s ad engagement just improved” gets acted on immediately by both sides, not surfaced three weeks later in a quarterly report.
What this means if you’re an indie developer or a small studio?
If you’re an indie game publisher, or handling indie game publishing duties across UA, monetization, and product because your team is still small, all of this can sound like infrastructure you don’t have time to build. The good news: you don’t need to build an attribution pipeline from scratch. This is exactly the layer a mobile app monetization platform should be providing for you as part of mediation, not as a separate project.
A mobile ad mediation platform sits at the exact point at which every ad impression, every user, and every revenue event already passes through. That’s the natural place for user-level ad revenue attribution to live, and it’s why choosing a monetization platform that exposes this data, rather than locking it inside a black-box waterfall, matters as much for an indie game publisher as it does for a large mobile game publisher running dozens of live UA campaigns.
A practical version of this guide for a small team
- Make sure your mediation SDK supports impression-level revenue reporting
- Confirm your MMP is receiving that ad-revenue data and joining it to install source; this is the join that makes blended RoAS possible.
- Start reviewing blended ARPU and blended RoAS even if it’s a manual spreadsheet exercise at first. The habit of looking at both revenue streams together matters more, early on, than the sophistication of the tooling.
How CAS.AI supports this
We built CAS.AI as an independent mediation layer that doesn’t run its own competing ad network. As a growth operator, we are helping developers and publishers maximize revenue across UA and monetization. That means every network in your waterfall, including your existing partners, gets the same treatment, and you get granular, user-level ad revenue attribution across all of them, not just the ones we’d prefer to promote.
As a growth operator, our incentive is aligned with yours: better attribution data means better decisions, and better decisions mean more revenue flowing through mediation. That’s why CAS.AI is built to expose impression-level revenue data, join it to your UA campaigns and creatives, and give both your UA and monetization teams a shared, blended view of RoAS, not two dashboards that never talk to each other.
Whether you’re an indie developer running your first hybrid-monetization title or a CMO managing UA spend across a portfolio of live games, the fix isn’t a bigger team or a longer reporting cycle. It’s making sure the data both teams need already lives in one place, attributed at the user level, before either team makes a spend decision.
Common mistakes that keep RoAS lower than it should be
Even teams that understand the theory above often trip on the same handful of execution mistakes:
Treating attribution as a one-time project. User-level ad revenue attribution isn’t a report you generate once and file away. Ad networks change their eCPM behavior, mediation waterfalls shift, and creative fatigue constantly changes engagement behaviors. Blended RoAS needs to be a living number both teams check on a fixed cadence, not a one-off audit.
Optimizing UA and monetization on different time horizons. UA teams often want fast signal (D3, D7) to make quick bid decisions. Monetization value, especially from ad revenue, often takes longer to mature. Forcing both teams to agree on a single maturity window, even if it means UA accepts a slightly slower decision cycle, prevents each side from optimizing against a horizon the other doesn’t recognize.
Ignoring creative-level differences in advertisement engagement. Two advertisement creatives can perform identically on install cost and even on D7 retention, and still produce very different downstream advertisement engagement. Without creative-level attribution, this difference stays invisible until it shows up as an unexplained RoAS gap weeks later.
Assuming a bigger mediation stack automatically means better data. Adding more ad networks to a waterfall increases fill rate and competition, but it doesn’t automatically produce better attribution. If your mediation platform isn’t set up to report impression-level revenue back to your MMP in a form that joins cleanly to install source, more networks means more noise to reconcile.
To maximize RoAS on a mobile app over the long run, the fix for all four of these is the same: build the shared, attributed data layer once, keep both teams looking at it on the same cadence, and let decisions follow the data instead of following whichever team’s dashboard is easiest to read that week.
Key Takeaways
- RoAS calculated on IAP (In-App Purchase) revenue alone is incomplete for hybrid-monetization apps; it can hide or misrepresent your best-performing campaigns.
- User-level ad revenue attribution ties every ad impression back to the individual user, and that user back to their acquisition campaign, creative, and network.
- Blended metrics (ARPU, LTV, RoAS) should combine IAP (In-App Purchase) and attributed ad revenue, and both UA and monetization teams should review them together, on a shared cadence.
- CPA and LTV only mean something when compared on the same basis: a cheap CPA that produces low-engagement users can cost more than an expensive one that produces durable, ad-engaged users.
- Maturity windows matter: ad-heavy hybrid titles often show a slower, longer RoAS curve than pure-IAP (In-App Purchase) games, so judging them on a short window built for IAP (In-App Purchase) undervalues them.
- The fix doesn’t require a data team from scratch; it requires a mediation platform that exposes impression-level revenue data and an MMP that joins it to install source.
FAQ
What is RoAS in mobile app marketing?
RoAS (Return on Ad Spend) measures how much revenue a UA campaign generates relative to what it costs to acquire those users. For an accurate picture, RoAS should include both IAP (In-App Purchase) revenue and attributed in-app advertising revenue, not just one or the other.
What’s considered a good RoAS for mobile games?
There’s no single universal figure; it depends on your monetization mix and maturity window. A useful heuristic is tracking RoAS trending toward 100%+ by D30-D90, with hybrid-monetization titles often showing a slower but more durable curve than pure-IAP (In-App Purchase) games.
Why doesn’t my UA dashboard show accurate RoAS?
Most UA dashboards default to IAP (In-App Purchase)-only revenue because it’s the easiest data to attribute at the user level. In-app ad revenue usually arrives aggregated from the ad network or mediation platform, without a built-in link back to individual users or campaigns, which is exactly the gap user-level ad revenue attribution closes.
How is ARPU different from LTV?
ARPU (Average Revenue Per User) is a snapshot: revenue per user over a defined period. LTV (Lifetime Value) is a projection: the total revenue a user is expected to generate over their full lifecycle. Both should be blended across IAP (In-App Purchase) and ad revenue to be useful for UA decision-making.
Can indie developers implement user-level ad revenue attribution without a data team? Yes, this function should come from your mediation platform and MMP, not require custom infrastructure. Confirm impression-level revenue reporting is enabled in your mediation SDK and properly joined to the install source in your MMP; the analysis itself can start as a manual review before you invest in more sophisticated tooling.